Data
87,996 items of data are available, covering 83,313 participants.
Defined-instances run from 2 to 3, labelled using Instancing
2.
Units of measurement are mm3.
| Maximum | 10567.8 |
| Decile 9 | 5187.9 |
| Decile 8 | 4925.9 |
| Decile 7 | 4739.6 |
| Decile 6 | 4590.55 |
| Median | 4453.5 |
| Decile 4 | 4319.7 |
| Decile 3 | 4175.9 |
| Decile 2 | 4014.7 |
| Decile 1 | 3796.25 |
| Minimum | 1134.6 |
|
|
- Mean = 4476.9
- Std.dev = 554.454
- 15 items below graph minimum of 2404.6
- 108 items above graph maximum of 6579.55
|
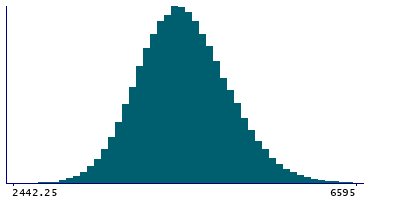
2 Instances
Instance 2 : Imaging visit (2014+)
83,241 participants, 83,241 items
| Maximum | 10567.8 |
| Decile 9 | 5187 |
| Decile 8 | 4923.4 |
| Decile 7 | 4737.1 |
| Decile 6 | 4589 |
| Median | 4451.9 |
| Decile 4 | 4318.1 |
| Decile 3 | 4173.9 |
| Decile 2 | 4012.95 |
| Decile 1 | 3794.2 |
| Minimum | 1603.4 |
|

|
- Mean = 4475.23
- Std.dev = 555.087
- 12 items below graph minimum of 2401.4
- 107 items above graph maximum of 6579.8
|
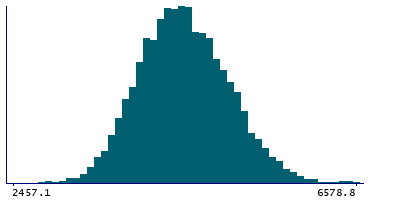
Instance 3 : First repeat imaging visit (2019+)
4,755 participants, 4,755 items
| Maximum | 6742.3 |
| Decile 9 | 5204.9 |
| Decile 8 | 4961.7 |
| Decile 7 | 4780.85 |
| Decile 6 | 4620.7 |
| Median | 4484.55 |
| Decile 4 | 4347.2 |
| Decile 3 | 4212.55 |
| Decile 2 | 4049.7 |
| Decile 1 | 3831 |
| Minimum | 1134.6 |
|
|
- Mean = 4506.21
- Std.dev = 542.417
- 2 items below graph minimum of 2457.1
- 1 item above graph maximum of 6578.8
|
Notes
Volume of Putamen in the left hemisphere generated by subcortical volumetric segmentation (aseg)
0 Related Data-Fields
There are no related data-fields
0 Resources
There are no matching Resources
