Data
87,996 items of data are available, covering 83,313 participants.
Defined-instances run from 2 to 3, labelled using Instancing
2.
Units of measurement are mm3.
| Maximum | 4066.5 |
| Decile 9 | 2308.7 |
| Decile 8 | 2196.1 |
| Decile 7 | 2119.5 |
| Decile 6 | 2055.4 |
| Median | 1997.2 |
| Decile 4 | 1939.5 |
| Decile 3 | 1880.3 |
| Decile 2 | 1813.3 |
| Decile 1 | 1720.9 |
| Minimum | 402.3 |
|
|
- Mean = 2007.45
- Std.dev = 232.24
- 4 items below graph minimum of 1133.1
- 53 items above graph maximum of 2896.5
|
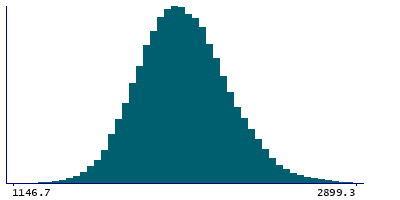
2 Instances
Instance 2 : Imaging visit (2014+)
83,241 participants, 83,241 items
| Maximum | 4066.5 |
| Decile 9 | 2308 |
| Decile 8 | 2195.2 |
| Decile 7 | 2118.6 |
| Decile 6 | 2054.3 |
| Median | 1995.95 |
| Decile 4 | 1938.4 |
| Decile 3 | 1879.4 |
| Decile 2 | 1812.1 |
| Decile 1 | 1719.6 |
| Minimum | 402.3 |
|

|
- Mean = 2006.45
- Std.dev = 232.369
- 3 items below graph minimum of 1131.2
- 52 items above graph maximum of 2896.4
|
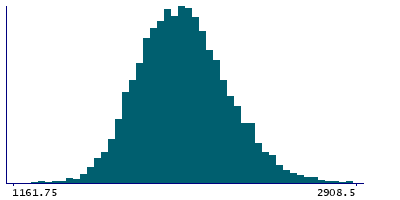
Instance 3 : First repeat imaging visit (2019+)
4,755 participants, 4,755 items
| Maximum | 3151.7 |
| Decile 9 | 2326.25 |
| Decile 8 | 2210.1 |
| Decile 7 | 2134.75 |
| Decile 6 | 2071.9 |
| Median | 2014.9 |
| Decile 4 | 1956.2 |
| Decile 3 | 1897.5 |
| Decile 2 | 1830.7 |
| Decile 1 | 1744 |
| Minimum | 536.3 |
|
|
- Mean = 2025.06
- Std.dev = 229.246
- 1 item below graph minimum of 1161.75
- 1 item above graph maximum of 2908.5
|
Notes
Volume of Pallidum in the left hemisphere generated by subcortical volumetric segmentation (aseg)
0 Related Data-Fields
There are no related data-fields
0 Resources
There are no matching Resources
