Data
87,996 items of data are available, covering 83,313 participants.
Defined-instances run from 2 to 3, labelled using Instancing
2.
Units of measurement are mm3.
| Maximum | 2736.1 |
| Decile 9 | 1814.6 |
| Decile 8 | 1705 |
| Decile 7 | 1628.9 |
| Decile 6 | 1565.2 |
| Median | 1508.9 |
| Decile 4 | 1452.9 |
| Decile 3 | 1395.6 |
| Decile 2 | 1330.5 |
| Decile 1 | 1240.2 |
| Minimum | 203.6 |
|

|
- Mean = 1519.28
- Std.dev = 228.727
- 24 items below graph minimum of 665.8
- 37 items above graph maximum of 2389
|
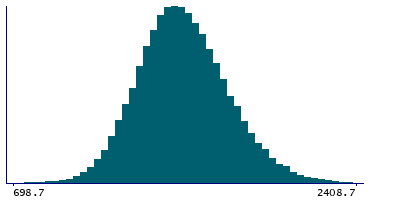
2 Instances
Instance 2 : Imaging visit (2014+)
83,241 participants, 83,241 items
| Maximum | 2736.1 |
| Decile 9 | 1813 |
| Decile 8 | 1703.2 |
| Decile 7 | 1627.6 |
| Decile 6 | 1563.7 |
| Median | 1507.5 |
| Decile 4 | 1451.5 |
| Decile 3 | 1394 |
| Decile 2 | 1329 |
| Decile 1 | 1238.6 |
| Minimum | 203.6 |
|
|
- Mean = 1517.79
- Std.dev = 228.803
- 19 items below graph minimum of 664.2
- 37 items above graph maximum of 2387.4
|
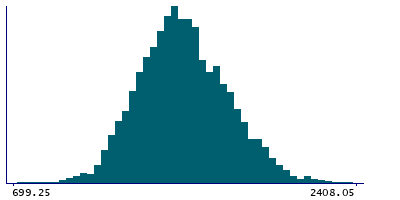
Instance 3 : First repeat imaging visit (2019+)
4,755 participants, 4,755 items
| Maximum | 2624.8 |
| Decile 9 | 1838.45 |
| Decile 8 | 1733.3 |
| Decile 7 | 1651.45 |
| Decile 6 | 1589.6 |
| Median | 1533.4 |
| Decile 4 | 1480.2 |
| Decile 3 | 1425.45 |
| Decile 2 | 1356.2 |
| Decile 1 | 1268.85 |
| Minimum | 392.6 |
|
|
- Mean = 1545.41
- Std.dev = 225.804
- 5 items below graph minimum of 699.25
- 2 items above graph maximum of 2408.05
|
Notes
Volume of Amygdala in the left hemisphere generated by subcortical volumetric segmentation (aseg)
0 Related Data-Fields
There are no related data-fields
0 Resources
There are no matching Resources
