Data
87,996 items of data are available, covering 83,313 participants.
Defined-instances run from 2 to 3, labelled using Instancing
2.
Units of measurement are mm3.
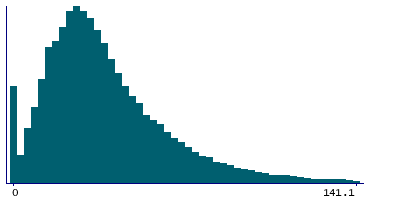
| Maximum | 1775.3 |
| Decile 9 | 76.9 |
| Decile 8 | 57.95 |
| Decile 7 | 47 |
| Decile 6 | 39.3 |
| Median | 33.4 |
| Decile 4 | 28.3 |
| Decile 3 | 23.5 |
| Decile 2 | 18.1 |
| Decile 1 | 11.6 |
| Minimum | 0 |
|
|
- Mean = 41.6782
- Std.dev = 39.8316
- 1613 items above graph maximum of 142.2
|
2 Instances
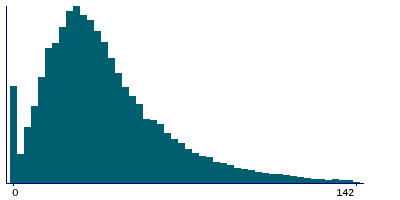
Instance 2 : Imaging visit (2014+)
83,241 participants, 83,241 items
| Maximum | 1775.3 |
| Decile 9 | 77.1 |
| Decile 8 | 58.1 |
| Decile 7 | 47.1 |
| Decile 6 | 39.4 |
| Median | 33.5 |
| Decile 4 | 28.3 |
| Decile 3 | 23.5 |
| Decile 2 | 18.2 |
| Decile 1 | 11.7 |
| Minimum | 0 |
|
|
- Mean = 41.7937
- Std.dev = 39.9434
- 1527 items above graph maximum of 142.5
|
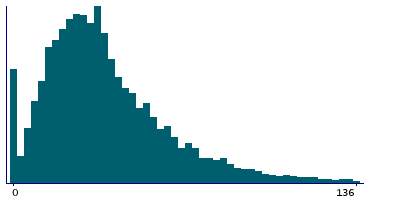
Instance 3 : First repeat imaging visit (2019+)
4,755 participants, 4,755 items
| Maximum | 1093.4 |
| Decile 9 | 73.2 |
| Decile 8 | 55.4 |
| Decile 7 | 45.1 |
| Decile 6 | 37.5 |
| Median | 32.5 |
| Decile 4 | 27.3 |
| Decile 3 | 22.4 |
| Decile 2 | 16.9 |
| Decile 1 | 10.4 |
| Minimum | 0 |
|
|
- Mean = 39.6564
- Std.dev = 37.7632
- 83 items above graph maximum of 136
|
Notes
Volume of vessel in the left hemisphere generated by subcortical volumetric segmentation (aseg)
0 Related Data-Fields
There are no related data-fields
0 Resources
There are no matching Resources
