Data
87,996 items of data are available, covering 83,313 participants.
Defined-instances run from 2 to 3, labelled using Instancing
2.
Units of measurement are AU.
| Maximum | 77.5617 |
| Decile 9 | 70.3413 |
| Decile 8 | 69.7178 |
| Decile 7 | 69.2703 |
| Decile 6 | 68.8772 |
| Median | 68.5022 |
| Decile 4 | 68.115 |
| Decile 3 | 67.6732 |
| Decile 2 | 67.1108 |
| Decile 1 | 66.2192 |
| Minimum | 40.8301 |
|
|
- Mean = 68.3643
- Std.dev = 1.69126
- 212 items below graph minimum of 62.0972
- 10 items above graph maximum of 74.4633
|
2 Instances
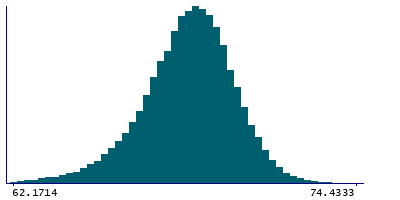
Instance 2 : Imaging visit (2014+)
83,241 participants, 83,241 items
| Maximum | 77.5617 |
| Decile 9 | 70.3444 |
| Decile 8 | 69.718 |
| Decile 7 | 69.2686 |
| Decile 6 | 68.876 |
| Median | 68.5014 |
| Decile 4 | 68.1148 |
| Decile 3 | 67.6723 |
| Decile 2 | 67.1116 |
| Decile 1 | 66.2199 |
| Minimum | 40.8301 |
|

|
- Mean = 68.3646
- Std.dev = 1.69094
- 197 items below graph minimum of 62.0953
- 8 items above graph maximum of 74.469
|
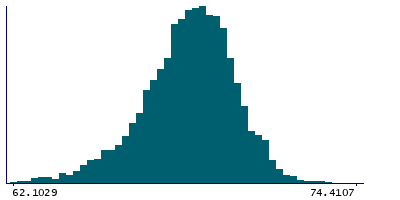
Instance 3 : First repeat imaging visit (2019+)
4,755 participants, 4,755 items
| Maximum | 76.6615 |
| Decile 9 | 70.307 |
| Decile 8 | 69.7107 |
| Decile 7 | 69.2952 |
| Decile 6 | 68.9054 |
| Median | 68.5186 |
| Decile 4 | 68.1157 |
| Decile 3 | 67.6913 |
| Decile 2 | 67.0985 |
| Decile 1 | 66.208 |
| Minimum | 55.146 |
|
|
- Mean = 68.3584
- Std.dev = 1.69686
- 13 items below graph minimum of 62.109
- 3 items above graph maximum of 74.406
|
Notes
Mean intensity of Hippocampus in the right hemisphere generated by subcortical volumetric segmentation (aseg)
0 Related Data-Fields
There are no related data-fields
0 Resources
There are no matching Resources
