Data
87,996 items of data are available, covering 83,313 participants.
Defined-instances run from 2 to 3, labelled using Instancing
2.
Units of measurement are AU.
| Maximum | 88.3475 |
| Decile 9 | 80.3791 |
| Decile 8 | 79.3295 |
| Decile 7 | 78.603 |
| Decile 6 | 78.0067 |
| Median | 77.4676 |
| Decile 4 | 76.9514 |
| Decile 3 | 76.4033 |
| Decile 2 | 75.7759 |
| Decile 1 | 74.9048 |
| Minimum | 55.2619 |
|

|
- Mean = 77.5551
- Std.dev = 2.18523
- 56 items below graph minimum of 69.4305
- 22 items above graph maximum of 85.8534
|
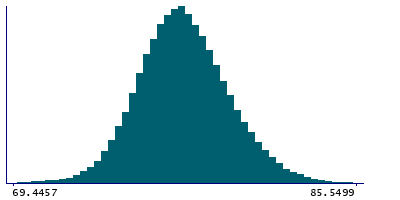
2 Instances
Instance 2 : Imaging visit (2014+)
83,241 participants, 83,241 items
| Maximum | 88.3475 |
| Decile 9 | 80.3965 |
| Decile 8 | 79.345 |
| Decile 7 | 78.6166 |
| Decile 6 | 78.0147 |
| Median | 77.4768 |
| Decile 4 | 76.9585 |
| Decile 3 | 76.4083 |
| Decile 2 | 75.7775 |
| Decile 1 | 74.9057 |
| Minimum | 55.2619 |
|
|
- Mean = 77.5634
- Std.dev = 2.19269
- 53 items below graph minimum of 69.4149
- 21 items above graph maximum of 85.8872
|
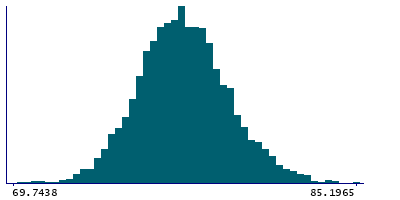
Instance 3 : First repeat imaging visit (2019+)
4,755 participants, 4,755 items
| Maximum | 85.9475 |
| Decile 9 | 80.0456 |
| Decile 8 | 79.0456 |
| Decile 7 | 78.3919 |
| Decile 6 | 77.8569 |
| Median | 77.3484 |
| Decile 4 | 76.8456 |
| Decile 3 | 76.3257 |
| Decile 2 | 75.7258 |
| Decile 1 | 74.8954 |
| Minimum | 66.6591 |
|
|
- Mean = 77.4093
- Std.dev = 2.04459
- 2 items below graph minimum of 69.7452
- 2 items above graph maximum of 85.1958
|
Notes
Mean intensity of Accumbens-area in the right hemisphere generated by subcortical volumetric segmentation (aseg)
0 Related Data-Fields
There are no related data-fields
0 Resources
There are no matching Resources
