Data
87,996 items of data are available, covering 83,313 participants.
Defined-instances run from 2 to 3, labelled using Instancing
2.
Units of measurement are mm3.
| Maximum | 2259.7 |
| Decile 9 | 60.7 |
| Decile 8 | 41.3 |
| Decile 7 | 33.6 |
| Decile 6 | 29.1 |
| Median | 25.8 |
| Decile 4 | 22.6 |
| Decile 3 | 19.3 |
| Decile 2 | 15.4 |
| Decile 1 | 10.2 |
| Minimum | 0 |
|

|
- Mean = 32.9177
- Std.dev = 34.1109
- 2255 items above graph maximum of 111.2
|
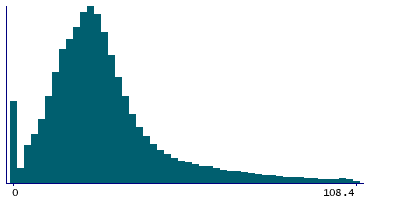
2 Instances
Instance 2 : Imaging visit (2014+)
83,241 participants, 83,241 items
| Maximum | 2259.7 |
| Decile 9 | 60.8 |
| Decile 8 | 41.3 |
| Decile 7 | 33.7 |
| Decile 6 | 29.2 |
| Median | 25.8 |
| Decile 4 | 22.7 |
| Decile 3 | 19.3 |
| Decile 2 | 15.4 |
| Decile 1 | 10.3 |
| Minimum | 0 |
|
|
- Mean = 32.968
- Std.dev = 34.2647
- 2131 items above graph maximum of 111.3
|
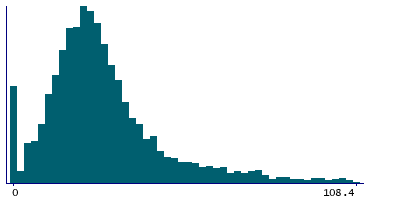
Instance 3 : First repeat imaging visit (2019+)
4,755 participants, 4,755 items
| Maximum | 546.5 |
| Decile 9 | 59.1 |
| Decile 8 | 40.6 |
| Decile 7 | 33.3 |
| Decile 6 | 28.7 |
| Median | 25.1 |
| Decile 4 | 22 |
| Decile 3 | 18.75 |
| Decile 2 | 15.1 |
| Decile 1 | 9.8 |
| Minimum | 0 |
|
|
- Mean = 32.0375
- Std.dev = 31.2843
- 129 items above graph maximum of 108.4
|
Notes
Volume of vessel in the right hemisphere generated by subcortical volumetric segmentation (aseg)
0 Related Data-Fields
There are no related data-fields
0 Resources
There are no matching Resources
