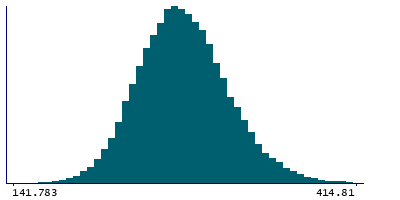
Data
87,996 items of data are available, covering 83,313 participants.
Defined-instances run from 2 to 3, labelled using Instancing
2.
Units of measurement are mm3.
| Maximum | 508.856 |
| Decile 9 | 319.973 |
| Decile 8 | 302.249 |
| Decile 7 | 290.478 |
| Decile 6 | 280.502 |
| Median | 271.417 |
| Decile 4 | 262.586 |
| Decile 3 | 253.193 |
| Decile 2 | 242.302 |
| Decile 1 | 227.922 |
| Minimum | 45.5191 |
|
|
- Mean = 272.864
- Std.dev = 36.6198
- 18 items below graph minimum of 135.871
- 62 items above graph maximum of 412.024
|
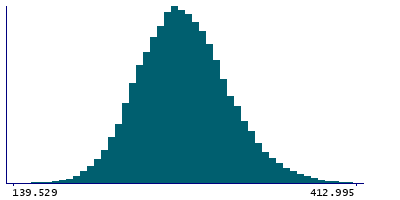
2 Instances
Instance 2 : Imaging visit (2014+)
83,241 participants, 83,241 items
| Maximum | 508.856 |
| Decile 9 | 319.561 |
| Decile 8 | 301.856 |
| Decile 7 | 290.17 |
| Decile 6 | 280.183 |
| Median | 271.07 |
| Decile 4 | 262.244 |
| Decile 3 | 252.884 |
| Decile 2 | 241.9 |
| Decile 1 | 227.562 |
| Minimum | 100.254 |
|
|
- Mean = 272.532
- Std.dev = 36.6177
- 15 items below graph minimum of 135.563
- 60 items above graph maximum of 411.56
|
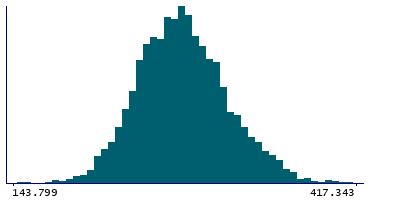
Instance 3 : First repeat imaging visit (2019+)
4,755 participants, 4,755 items
| Maximum | 452.909 |
| Decile 9 | 326.162 |
| Decile 8 | 307.591 |
| Decile 7 | 295.859 |
| Decile 6 | 285.509 |
| Median | 277.14 |
| Decile 4 | 268.132 |
| Decile 3 | 258.852 |
| Decile 2 | 248.631 |
| Decile 1 | 234.98 |
| Minimum | 45.5191 |
|
|
- Mean = 278.678
- Std.dev = 36.1663
- 4 items below graph minimum of 143.799
- 3 items above graph maximum of 417.343
|
Notes
Volume of subiculum-body in the left hemisphere generated by subcortical volumetric sub-segmentation of the Hippocampal Subfields
0 Related Data-Fields
There are no related data-fields
0 Resources
There are no matching Resources
