Data
87,996 items of data are available, covering 83,313 participants.
Defined-instances run from 2 to 3, labelled using Instancing
2.
Units of measurement are mm3.
| Maximum | 270.623 |
| Decile 9 | 179.975 |
| Decile 8 | 168.496 |
| Decile 7 | 160.767 |
| Decile 6 | 154.138 |
| Median | 148.014 |
| Decile 4 | 142.077 |
| Decile 3 | 135.842 |
| Decile 2 | 128.524 |
| Decile 1 | 118.276 |
| Minimum | 22.1532 |
|

|
- Mean = 148.668
- Std.dev = 24.5604
- 52 items above graph maximum of 241.674
|
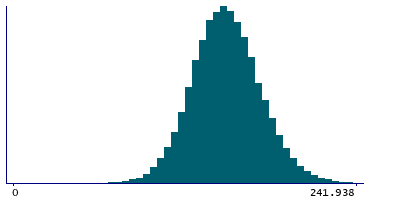
2 Instances
Instance 2 : Imaging visit (2014+)
83,241 participants, 83,241 items
| Maximum | 270.623 |
| Decile 9 | 179.785 |
| Decile 8 | 168.345 |
| Decile 7 | 160.599 |
| Decile 6 | 153.964 |
| Median | 147.827 |
| Decile 4 | 141.879 |
| Decile 3 | 135.648 |
| Decile 2 | 128.33 |
| Decile 1 | 118.019 |
| Minimum | 22.1532 |
|
|
- Mean = 148.476
- Std.dev = 24.5892
- 49 items above graph maximum of 241.552
|
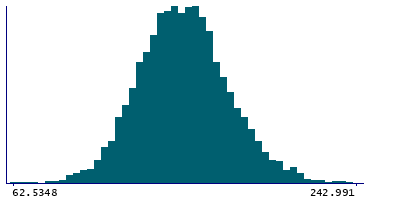
Instance 3 : First repeat imaging visit (2019+)
4,755 participants, 4,755 items
| Maximum | 252.176 |
| Decile 9 | 182.839 |
| Decile 8 | 171.33 |
| Decile 7 | 163.545 |
| Decile 6 | 157.357 |
| Median | 151.417 |
| Decile 4 | 145.409 |
| Decile 3 | 139.407 |
| Decile 2 | 132.239 |
| Decile 1 | 122.687 |
| Minimum | 38.9758 |
|
|
- Mean = 152.021
- Std.dev = 23.8028
- 2 items below graph minimum of 62.5348
- 3 items above graph maximum of 242.991
|
Notes
Volume of CA3-head in the left hemisphere generated by subcortical volumetric sub-segmentation of the Hippocampal Subfields
0 Related Data-Fields
There are no related data-fields
0 Resources
There are no matching Resources
