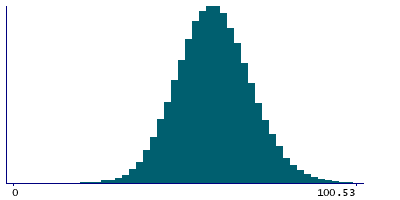
Data
87,996 items of data are available, covering 83,313 participants.
Defined-instances run from 2 to 3, labelled using Instancing
2.
Units of measurement are mm3.
| Maximum | 117.899 |
| Decile 9 | 72.3005 |
| Decile 8 | 67.2217 |
| Decile 7 | 63.6656 |
| Decile 6 | 60.6647 |
| Median | 57.9148 |
| Decile 4 | 55.1626 |
| Decile 3 | 52.2581 |
| Decile 2 | 48.925 |
| Decile 1 | 44.2308 |
| Minimum | 6.27511 |
|
|
- Mean = 58.141
- Std.dev = 11.0749
- 37 items above graph maximum of 100.37
|
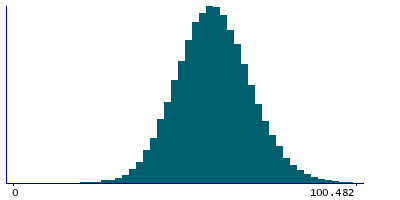
2 Instances
Instance 2 : Imaging visit (2014+)
83,241 participants, 83,241 items
| Maximum | 117.899 |
| Decile 9 | 72.2248 |
| Decile 8 | 67.131 |
| Decile 7 | 63.5805 |
| Decile 6 | 60.5816 |
| Median | 57.8311 |
| Decile 4 | 55.0858 |
| Decile 3 | 52.1878 |
| Decile 2 | 48.8281 |
| Decile 1 | 44.1534 |
| Minimum | 6.27511 |
|
|
- Mean = 58.0669
- Std.dev = 11.081
- 37 items above graph maximum of 100.296
|
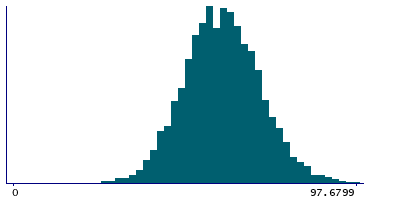
Instance 3 : First repeat imaging visit (2019+)
4,755 participants, 4,755 items
| Maximum | 97.6799 |
| Decile 9 | 73.3641 |
| Decile 8 | 68.4583 |
| Decile 7 | 65.0236 |
| Decile 6 | 62.0059 |
| Median | 59.2977 |
| Decile 4 | 56.2775 |
| Decile 3 | 53.5583 |
| Decile 2 | 50.3209 |
| Decile 1 | 45.764 |
| Minimum | 19.7256 |
|
|
- Mean = 59.4385
- Std.dev = 10.886
|
Notes
Volume of HATA in the left hemisphere generated by subcortical volumetric sub-segmentation of the Hippocampal Subfields
0 Related Data-Fields
There are no related data-fields
0 Resources
There are no matching Resources
