Data
87,996 items of data are available, covering 83,313 participants.
Defined-instances run from 2 to 3, labelled using Instancing
2.
Units of measurement are mm3.
| Maximum | 261.439 |
| Decile 9 | 81.5439 |
| Decile 8 | 73.3849 |
| Decile 7 | 67.5427 |
| Decile 6 | 62.5211 |
| Median | 57.804 |
| Decile 4 | 53.0221 |
| Decile 3 | 47.8388 |
| Decile 2 | 41.4064 |
| Decile 1 | 32.2871 |
| Minimum | 0.247731 |
|

|
- Mean = 57.4204
- Std.dev = 19.3097
- 33 items above graph maximum of 130.801
|
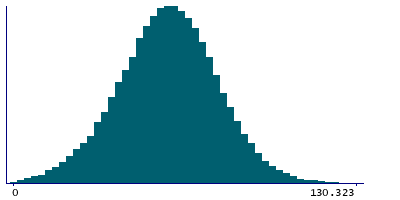
2 Instances
Instance 2 : Imaging visit (2014+)
83,241 participants, 83,241 items
| Maximum | 261.439 |
| Decile 9 | 81.4433 |
| Decile 8 | 73.2673 |
| Decile 7 | 67.4405 |
| Decile 6 | 62.4129 |
| Median | 57.6973 |
| Decile 4 | 52.9026 |
| Decile 3 | 47.6904 |
| Decile 2 | 41.2564 |
| Decile 1 | 32.1192 |
| Minimum | 0.247731 |
|
|
- Mean = 57.2907
- Std.dev = 19.3173
- 31 items above graph maximum of 130.767
|
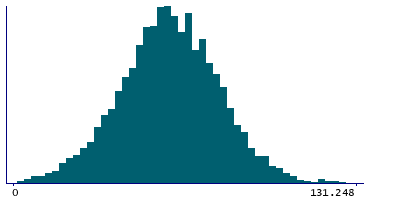
Instance 3 : First repeat imaging visit (2019+)
4,755 participants, 4,755 items
| Maximum | 193.39 |
| Decile 9 | 83.2515 |
| Decile 8 | 75.2383 |
| Decile 7 | 69.3883 |
| Decile 6 | 64.5024 |
| Median | 59.6631 |
| Decile 4 | 55.2201 |
| Decile 3 | 50.2229 |
| Decile 2 | 44.1505 |
| Decile 1 | 35.2546 |
| Minimum | 2.6372 |
|
|
- Mean = 59.6905
- Std.dev = 19.0351
- 2 items above graph maximum of 131.248
|
Notes
Volume of fimbria in the right hemisphere generated by subcortical volumetric sub-segmentation of the Hippocampal Subfields
0 Related Data-Fields
There are no related data-fields
0 Resources
There are no matching Resources
