Data
87,996 items of data are available, covering 83,313 participants.
Defined-instances run from 2 to 3, labelled using Instancing
2.
Units of measurement are mm3.
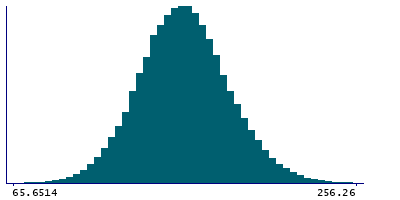
| Maximum | 391.132 |
| Decile 9 | 191.5 |
| Decile 8 | 179.542 |
| Decile 7 | 171.466 |
| Decile 6 | 164.721 |
| Median | 158.486 |
| Decile 4 | 152.254 |
| Decile 3 | 145.638 |
| Decile 2 | 137.936 |
| Decile 1 | 127.168 |
| Minimum | 25.2994 |
|
|
- Mean = 158.918
- Std.dev = 25.4897
- 35 items above graph maximum of 255.831
|
2 Instances
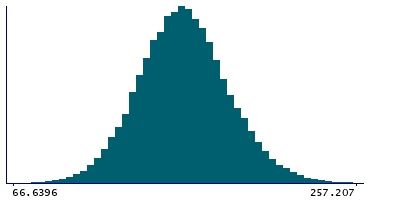
Instance 2 : Imaging visit (2014+)
83,241 participants, 83,241 items
| Maximum | 391.132 |
| Decile 9 | 191.302 |
| Decile 8 | 179.345 |
| Decile 7 | 171.302 |
| Decile 6 | 164.501 |
| Median | 158.241 |
| Decile 4 | 152.064 |
| Decile 3 | 145.405 |
| Decile 2 | 137.714 |
| Decile 1 | 126.852 |
| Minimum | 25.2994 |
|
|
- Mean = 158.699
- Std.dev = 25.5169
- 34 items above graph maximum of 255.752
|
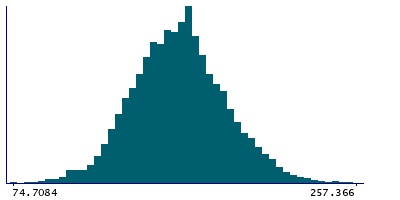
Instance 3 : First repeat imaging visit (2019+)
4,755 participants, 4,755 items
| Maximum | 259.909 |
| Decile 9 | 194.746 |
| Decile 8 | 182.951 |
| Decile 7 | 174.502 |
| Decile 6 | 168.256 |
| Median | 162.597 |
| Decile 4 | 156.283 |
| Decile 3 | 149.568 |
| Decile 2 | 142.25 |
| Decile 1 | 132.125 |
| Minimum | 74.7084 |
|
|
- Mean = 162.756
- Std.dev = 24.6939
- 1 item above graph maximum of 257.366
|
Notes
Volume of CA3-head in the right hemisphere generated by subcortical volumetric sub-segmentation of the Hippocampal Subfields
0 Related Data-Fields
There are no related data-fields
0 Resources
There are no matching Resources
