Data
87,996 items of data are available, covering 83,313 participants.
Defined-instances run from 2 to 3, labelled using Instancing
2.
Units of measurement are mm3.
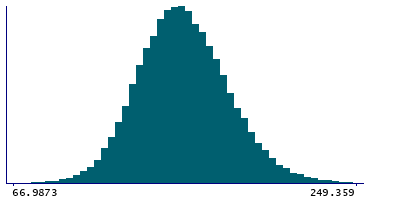
| Maximum | 333.187 |
| Decile 9 | 187.03 |
| Decile 8 | 175.385 |
| Decile 7 | 167.507 |
| Decile 6 | 160.751 |
| Median | 154.727 |
| Decile 4 | 148.865 |
| Decile 3 | 142.73 |
| Decile 2 | 135.55 |
| Decile 1 | 125.896 |
| Minimum | 26.3306 |
|
|
- Mean = 155.738
- Std.dev = 24.325
- 14 items below graph minimum of 64.763
- 66 items above graph maximum of 248.163
|
2 Instances
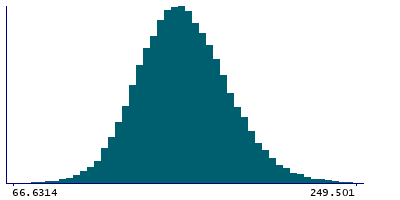
Instance 2 : Imaging visit (2014+)
83,241 participants, 83,241 items
| Maximum | 329.321 |
| Decile 9 | 186.936 |
| Decile 8 | 175.262 |
| Decile 7 | 167.372 |
| Decile 6 | 160.585 |
| Median | 154.566 |
| Decile 4 | 148.713 |
| Decile 3 | 142.579 |
| Decile 2 | 135.359 |
| Decile 1 | 125.657 |
| Minimum | 26.3306 |
|
|
- Mean = 155.571
- Std.dev = 24.3292
- 14 items below graph minimum of 64.3789
- 58 items above graph maximum of 248.215
|
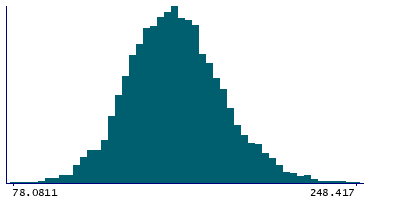
Instance 3 : First repeat imaging visit (2019+)
4,755 participants, 4,755 items
| Maximum | 333.187 |
| Decile 9 | 189.142 |
| Decile 8 | 177.59 |
| Decile 7 | 169.61 |
| Decile 6 | 163.535 |
| Median | 157.728 |
| Decile 4 | 151.818 |
| Decile 3 | 145.598 |
| Decile 2 | 138.798 |
| Decile 1 | 129.874 |
| Minimum | 78.0811 |
|
|
- Mean = 158.655
- Std.dev = 24.0643
- 7 items above graph maximum of 248.411
|
Notes
Volume of LGN in the left hemisphere generated by subcortical volumetric sub-segmentation of the Thalamic Nuclei
0 Related Data-Fields
There are no related data-fields
0 Resources
There are no matching Resources
