Data
87,996 items of data are available, covering 83,313 participants.
Defined-instances run from 2 to 3, labelled using Instancing
2.
Units of measurement are mm3.
| Maximum | 414.421 |
| Decile 9 | 185.457 |
| Decile 8 | 174.476 |
| Decile 7 | 166.987 |
| Decile 6 | 160.712 |
| Median | 154.906 |
| Decile 4 | 149.487 |
| Decile 3 | 143.918 |
| Decile 2 | 137.633 |
| Decile 1 | 129.388 |
| Minimum | 52.1181 |
|
|
- Mean = 156.524
- Std.dev = 22.291
- 2 items below graph minimum of 73.3187
- 88 items above graph maximum of 241.526
|
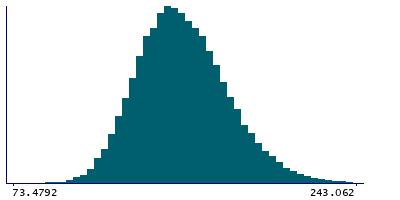
2 Instances
Instance 2 : Imaging visit (2014+)
83,241 participants, 83,241 items
| Maximum | 407.405 |
| Decile 9 | 185.423 |
| Decile 8 | 174.406 |
| Decile 7 | 166.9 |
| Decile 6 | 160.644 |
| Median | 154.801 |
| Decile 4 | 149.387 |
| Decile 3 | 143.805 |
| Decile 2 | 137.518 |
| Decile 1 | 129.296 |
| Minimum | 63.1773 |
|

|
- Mean = 156.436
- Std.dev = 22.2837
- 1 item below graph minimum of 73.1688
- 81 items above graph maximum of 241.549
|
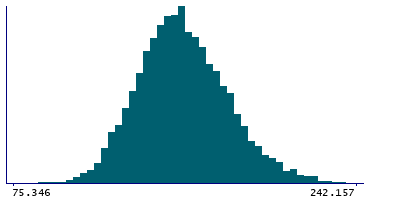
Instance 3 : First repeat imaging visit (2019+)
4,755 participants, 4,755 items
| Maximum | 414.421 |
| Decile 9 | 186.553 |
| Decile 8 | 175.854 |
| Decile 7 | 168.303 |
| Decile 6 | 162.016 |
| Median | 156.422 |
| Decile 4 | 151.282 |
| Decile 3 | 145.858 |
| Decile 2 | 139.633 |
| Decile 1 | 130.964 |
| Minimum | 52.1181 |
|
|
- Mean = 158.068
- Std.dev = 22.3637
- 1 item below graph minimum of 75.3754
- 7 items above graph maximum of 242.142
|
Notes
Volume of PuI in the left hemisphere generated by subcortical volumetric sub-segmentation of the Thalamic Nuclei
0 Related Data-Fields
There are no related data-fields
0 Resources
There are no matching Resources
