Data
87,996 items of data are available, covering 83,313 participants.
Defined-instances run from 2 to 3, labelled using Instancing
2.
Units of measurement are mm3.
| Maximum | 1839.53 |
| Decile 9 | 749.085 |
| Decile 8 | 714.836 |
| Decile 7 | 690.957 |
| Decile 6 | 669.913 |
| Median | 650.699 |
| Decile 4 | 631.705 |
| Decile 3 | 611.159 |
| Decile 2 | 587.768 |
| Decile 1 | 554.663 |
| Minimum | 290.688 |
|

|
- Mean = 651.688
- Std.dev = 76.6563
- 7 items below graph minimum of 360.242
- 46 items above graph maximum of 943.507
|
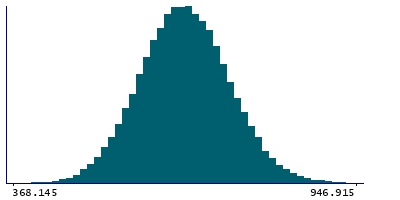
2 Instances
Instance 2 : Imaging visit (2014+)
83,241 participants, 83,241 items
| Maximum | 1839.53 |
| Decile 9 | 748.666 |
| Decile 8 | 714.408 |
| Decile 7 | 690.493 |
| Decile 6 | 669.364 |
| Median | 650.145 |
| Decile 4 | 631.016 |
| Decile 3 | 610.477 |
| Decile 2 | 587.057 |
| Decile 1 | 553.881 |
| Minimum | 290.688 |
|
|
- Mean = 651.124
- Std.dev = 76.6917
- 7 items below graph minimum of 359.096
- 41 items above graph maximum of 943.45
|
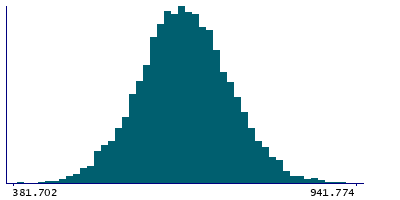
Instance 3 : First repeat imaging visit (2019+)
4,755 participants, 4,755 items
| Maximum | 1544.31 |
| Decile 9 | 755.024 |
| Decile 8 | 722.203 |
| Decile 7 | 698.988 |
| Decile 6 | 679.03 |
| Median | 660.461 |
| Decile 4 | 641.688 |
| Decile 3 | 622.607 |
| Decile 2 | 601.06 |
| Decile 1 | 568.393 |
| Minimum | 368.71 |
|
|
- Mean = 661.559
- Std.dev = 75.354
- 1 item below graph minimum of 381.761
- 5 items above graph maximum of 941.656
|
Notes
Volume of MDm in the left hemisphere generated by subcortical volumetric sub-segmentation of the Thalamic Nuclei
0 Related Data-Fields
There are no related data-fields
0 Resources
There are no matching Resources
