Data
87,996 items of data are available, covering 83,313 participants.
Defined-instances run from 2 to 3, labelled using Instancing
2.
Units of measurement are mm3.
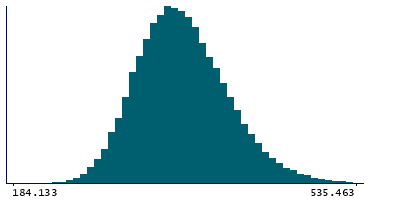
| Maximum | 1297.9 |
| Decile 9 | 416.865 |
| Decile 8 | 393.628 |
| Decile 7 | 377.65 |
| Decile 6 | 364.62 |
| Median | 352.972 |
| Decile 4 | 341.651 |
| Decile 3 | 329.944 |
| Decile 2 | 316.964 |
| Decile 1 | 300.061 |
| Minimum | 129.901 |
|
|
- Mean = 356.325
- Std.dev = 46.485
- 4 items below graph minimum of 183.256
- 81 items above graph maximum of 533.67
|
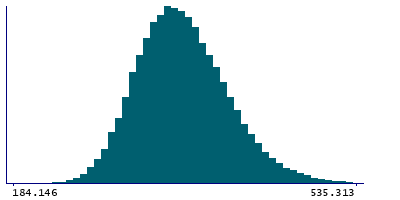
2 Instances
Instance 2 : Imaging visit (2014+)
83,241 participants, 83,241 items
| Maximum | 1297.9 |
| Decile 9 | 416.658 |
| Decile 8 | 393.534 |
| Decile 7 | 377.6 |
| Decile 6 | 364.528 |
| Median | 352.868 |
| Decile 4 | 341.534 |
| Decile 3 | 329.823 |
| Decile 2 | 316.856 |
| Decile 1 | 299.968 |
| Minimum | 129.901 |
|
|
- Mean = 356.197
- Std.dev = 46.4041
- 4 items below graph minimum of 183.279
- 72 items above graph maximum of 533.347
|
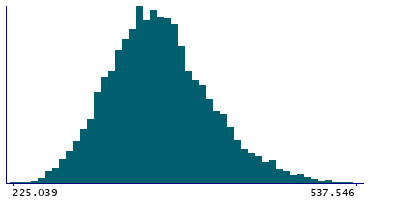
Instance 3 : First repeat imaging visit (2019+)
4,755 participants, 4,755 items
| Maximum | 858.891 |
| Decile 9 | 419.519 |
| Decile 8 | 395.603 |
| Decile 7 | 378.715 |
| Decile 6 | 366.493 |
| Median | 354.806 |
| Decile 4 | 343.72 |
| Decile 3 | 332.69 |
| Decile 2 | 319.209 |
| Decile 1 | 301.768 |
| Minimum | 225.039 |
|
|
- Mean = 358.555
- Std.dev = 47.8241
- 9 items above graph maximum of 537.27
|
Notes
Volume of VA in the left hemisphere generated by subcortical volumetric sub-segmentation of the Thalamic Nuclei
0 Related Data-Fields
There are no related data-fields
0 Resources
There are no matching Resources
