Data
87,996 items of data are available, covering 83,313 participants.
Defined-instances run from 2 to 3, labelled using Instancing
2.
Units of measurement are mm3.
| Maximum | 48.7683 |
| Decile 9 | 21.9306 |
| Decile 8 | 20.6718 |
| Decile 7 | 19.8252 |
| Decile 6 | 19.1237 |
| Median | 18.4873 |
| Decile 4 | 17.884 |
| Decile 3 | 17.2576 |
| Decile 2 | 16.5775 |
| Decile 1 | 15.6872 |
| Minimum | 9.20491 |
|
|
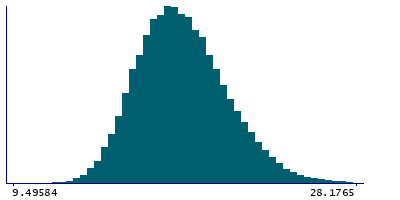
- Mean = 18.6767
- Std.dev = 2.46386
- 2 items below graph minimum of 9.44389
- 66 items above graph maximum of 28.1739
|
2 Instances
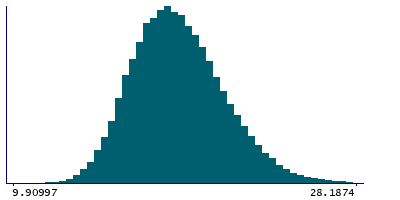
Instance 2 : Imaging visit (2014+)
83,241 participants, 83,241 items
| Maximum | 48.7683 |
| Decile 9 | 21.9298 |
| Decile 8 | 20.6737 |
| Decile 7 | 19.8264 |
| Decile 6 | 19.1218 |
| Median | 18.4866 |
| Decile 4 | 17.883 |
| Decile 3 | 17.2544 |
| Decile 2 | 16.5745 |
| Decile 1 | 15.6817 |
| Minimum | 9.35833 |
|
|
- Mean = 18.6748
- Std.dev = 2.46335
- 1 item below graph minimum of 9.43366
- 61 items above graph maximum of 28.1779
|
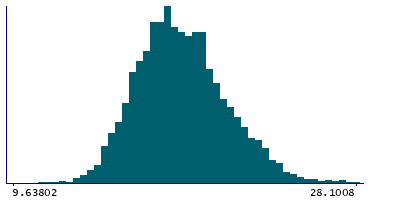
Instance 3 : First repeat imaging visit (2019+)
4,755 participants, 4,755 items
| Maximum | 47.823 |
| Decile 9 | 21.9459 |
| Decile 8 | 20.6402 |
| Decile 7 | 19.8049 |
| Decile 6 | 19.1651 |
| Median | 18.5142 |
| Decile 4 | 17.9039 |
| Decile 3 | 17.3131 |
| Decile 2 | 16.6502 |
| Decile 1 | 15.7923 |
| Minimum | 9.20491 |
|
|
- Mean = 18.7106
- Std.dev = 2.47252
- 1 item below graph minimum of 9.63864
- 4 items above graph maximum of 28.0996
|
Notes
Volume of VM in the left hemisphere generated by subcortical volumetric sub-segmentation of the Thalamic Nuclei
0 Related Data-Fields
There are no related data-fields
0 Resources
There are no matching Resources
