Data
87,996 items of data are available, covering 83,313 participants.
Defined-instances run from 2 to 3, labelled using Instancing
2.
Units of measurement are mm3.
| Maximum | 546.347 |
| Decile 9 | 217.142 |
| Decile 8 | 203.418 |
| Decile 7 | 194.134 |
| Decile 6 | 186.67 |
| Median | 179.889 |
| Decile 4 | 173.425 |
| Decile 3 | 166.658 |
| Decile 2 | 159.226 |
| Decile 1 | 149.191 |
| Minimum | 70.5795 |
|
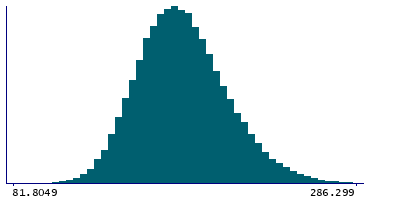
|
- Mean = 181.825
- Std.dev = 26.8237
- 1 item below graph minimum of 81.2403
- 81 items above graph maximum of 285.092
|
2 Instances
Instance 2 : Imaging visit (2014+)
83,241 participants, 83,241 items
| Maximum | 546.347 |
| Decile 9 | 217.028 |
| Decile 8 | 203.332 |
| Decile 7 | 194.043 |
| Decile 6 | 186.555 |
| Median | 179.791 |
| Decile 4 | 173.306 |
| Decile 3 | 166.528 |
| Decile 2 | 159.071 |
| Decile 1 | 149.013 |
| Minimum | 86.3559 |
|
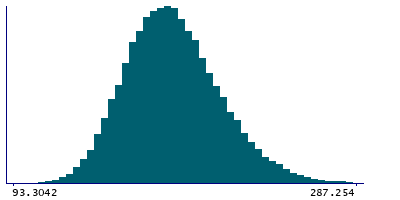
|
- Mean = 181.711
- Std.dev = 26.8355
- 75 items above graph maximum of 285.043
|
Instance 3 : First repeat imaging visit (2019+)
4,755 participants, 4,755 items
| Maximum | 423.93 |
| Decile 9 | 218.673 |
| Decile 8 | 204.751 |
| Decile 7 | 195.936 |
| Decile 6 | 188.571 |
| Median | 181.512 |
| Decile 4 | 175.46 |
| Decile 3 | 169.258 |
| Decile 2 | 161.645 |
| Decile 1 | 152.06 |
| Minimum | 70.5795 |
|
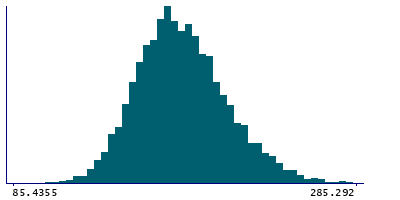
|
- Mean = 183.823
- Std.dev = 26.5362
- 1 item below graph minimum of 85.4479
- 6 items above graph maximum of 285.285
|
Notes
Volume of PuI in the right hemisphere generated by subcortical volumetric sub-segmentation of the Thalamic Nuclei
0 Related Data-Fields
There are no related data-fields
0 Resources
There are no matching Resources
