Data
87,996 items of data are available, covering 83,313 participants.
Defined-instances run from 2 to 3, labelled using Instancing
2.
Units of measurement are mm3.
| Maximum | 1490.33 |
| Decile 9 | 682.417 |
| Decile 8 | 645.767 |
| Decile 7 | 620.597 |
| Decile 6 | 599.98 |
| Median | 581.439 |
| Decile 4 | 563.603 |
| Decile 3 | 545.373 |
| Decile 2 | 524.878 |
| Decile 1 | 497.977 |
| Minimum | 273.448 |
|
|
- Mean = 586.596
- Std.dev = 72.6852
- 2 items below graph minimum of 313.536
- 66 items above graph maximum of 866.858
|
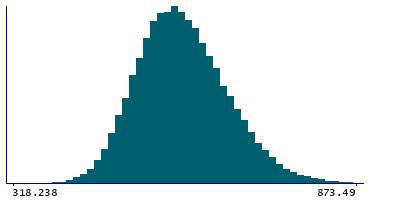
2 Instances
Instance 2 : Imaging visit (2014+)
83,241 participants, 83,241 items
| Maximum | 1490.33 |
| Decile 9 | 682.19 |
| Decile 8 | 645.487 |
| Decile 7 | 620.386 |
| Decile 6 | 599.731 |
| Median | 581.148 |
| Decile 4 | 563.287 |
| Decile 3 | 545.06 |
| Decile 2 | 524.551 |
| Decile 1 | 497.68 |
| Minimum | 273.448 |
|
|
- Mean = 586.332
- Std.dev = 72.6629
- 2 items below graph minimum of 313.17
- 61 items above graph maximum of 866.701
|
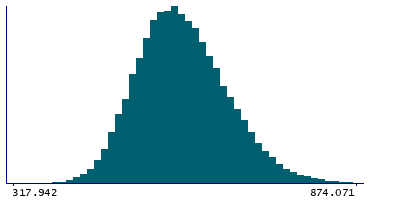
Instance 3 : First repeat imaging visit (2019+)
4,755 participants, 4,755 items
| Maximum | 1287.87 |
| Decile 9 | 685.273 |
| Decile 8 | 650.25 |
| Decile 7 | 625.105 |
| Decile 6 | 604.402 |
| Median | 586.645 |
| Decile 4 | 568.985 |
| Decile 3 | 550.356 |
| Decile 2 | 530.362 |
| Decile 1 | 503.389 |
| Minimum | 329.791 |
|

|
- Mean = 591.212
- Std.dev = 72.9194
- 5 items above graph maximum of 867.158
|
Notes
Volume of VLa in the right hemisphere generated by subcortical volumetric sub-segmentation of the Thalamic Nuclei
0 Related Data-Fields
There are no related data-fields
0 Resources
There are no matching Resources
