Data
87,996 items of data are available, covering 83,313 participants.
Defined-instances run from 2 to 3, labelled using Instancing
2.
Units of measurement are mm3.
| Maximum | 18.7145 |
| Decile 9 | 6.88608 |
| Decile 8 | 6.49465 |
| Decile 7 | 6.21765 |
| Decile 6 | 5.99177 |
| Median | 5.79309 |
| Decile 4 | 5.60365 |
| Decile 3 | 5.41075 |
| Decile 2 | 5.19045 |
| Decile 1 | 4.90748 |
| Minimum | 3.19288 |
|

|
- Mean = 5.86017
- Std.dev = 0.793216
- 123 items above graph maximum of 8.86467
|
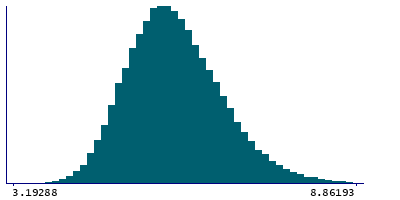
2 Instances
Instance 2 : Imaging visit (2014+)
83,241 participants, 83,241 items
| Maximum | 18.4806 |
| Decile 9 | 6.88511 |
| Decile 8 | 6.49403 |
| Decile 7 | 6.21672 |
| Decile 6 | 5.99099 |
| Median | 5.79227 |
| Decile 4 | 5.60281 |
| Decile 3 | 5.41011 |
| Decile 2 | 5.18908 |
| Decile 1 | 4.9067 |
| Minimum | 3.19288 |
|
|
- Mean = 5.85913
- Std.dev = 0.791715
- 116 items above graph maximum of 8.86352
|
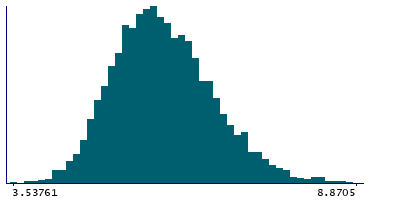
Instance 3 : First repeat imaging visit (2019+)
4,755 participants, 4,755 items
| Maximum | 18.7145 |
| Decile 9 | 6.89963 |
| Decile 8 | 6.51121 |
| Decile 7 | 6.2381 |
| Decile 6 | 6.01186 |
| Median | 5.8076 |
| Decile 4 | 5.61659 |
| Decile 3 | 5.42604 |
| Decile 2 | 5.2149 |
| Decile 1 | 4.9314 |
| Minimum | 3.53761 |
|
|
- Mean = 5.87844
- Std.dev = 0.818844
- 7 items above graph maximum of 8.86786
|
Notes
Volume of Pt in the right hemisphere generated by subcortical volumetric sub-segmentation of the Thalamic Nuclei
0 Related Data-Fields
There are no related data-fields
0 Resources
There are no matching Resources
