Data
87,996 items of data are available, covering 83,313 participants.
Defined-instances run from 2 to 3, labelled using Instancing
2.
Units of measurement are mm3.
| Maximum | 274.632 |
| Decile 9 | 148.454 |
| Decile 8 | 138.95 |
| Decile 7 | 132.562 |
| Decile 6 | 127.215 |
| Median | 122.479 |
| Decile 4 | 117.96 |
| Decile 3 | 113.223 |
| Decile 2 | 107.871 |
| Decile 1 | 100.797 |
| Minimum | 7.77017 |
|

|
- Mean = 123.833
- Std.dev = 19.1012
- 10 items below graph minimum of 53.1408
- 151 items above graph maximum of 196.11
|
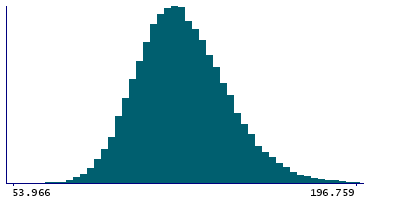
2 Instances
Instance 2 : Imaging visit (2014+)
83,241 participants, 83,241 items
| Maximum | 274.632 |
| Decile 9 | 148.478 |
| Decile 8 | 138.959 |
| Decile 7 | 132.524 |
| Decile 6 | 127.183 |
| Median | 122.443 |
| Decile 4 | 117.904 |
| Decile 3 | 113.195 |
| Decile 2 | 107.859 |
| Decile 1 | 100.789 |
| Minimum | 7.77017 |
|
|
- Mean = 123.813
- Std.dev = 19.1201
- 9 items below graph minimum of 53.0996
- 143 items above graph maximum of 196.167
|
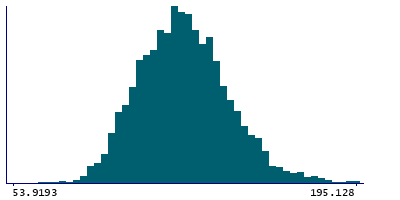
Instance 3 : First repeat imaging visit (2019+)
4,755 participants, 4,755 items
| Maximum | 240.314 |
| Decile 9 | 148.058 |
| Decile 8 | 138.893 |
| Decile 7 | 133.106 |
| Decile 6 | 127.813 |
| Median | 123.224 |
| Decile 4 | 118.845 |
| Decile 3 | 113.746 |
| Decile 2 | 107.949 |
| Decile 1 | 100.989 |
| Minimum | 24.6268 |
|
|
- Mean = 124.169
- Std.dev = 18.765
- 1 item below graph minimum of 53.9193
- 9 items above graph maximum of 195.128
|
Notes
Volume of AV in the right hemisphere generated by subcortical volumetric sub-segmentation of the Thalamic Nuclei
0 Related Data-Fields
There are no related data-fields
0 Resources
There are no matching Resources
