Data
87,996 items of data are available, covering 83,313 participants.
Defined-instances run from 2 to 3, labelled using Instancing
2.
Units of measurement are mm3.
| Maximum | 15302.7 |
| Decile 9 | 6476.14 |
| Decile 8 | 6207.05 |
| Decile 7 | 6021.15 |
| Decile 6 | 5866.23 |
| Median | 5725.24 |
| Decile 4 | 5584.87 |
| Decile 3 | 5442.72 |
| Decile 2 | 5279.16 |
| Decile 1 | 5067.14 |
| Minimum | 3264.66 |
|

|
- Mean = 5752.7
- Std.dev = 557.475
- 4 items below graph minimum of 3658.15
- 63 items above graph maximum of 7885.14
|
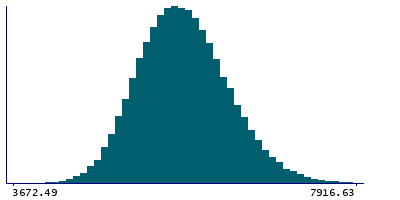
2 Instances
Instance 2 : Imaging visit (2014+)
83,241 participants, 83,241 items
| Maximum | 15302.7 |
| Decile 9 | 6473.59 |
| Decile 8 | 6204.63 |
| Decile 7 | 6018.72 |
| Decile 6 | 5864.32 |
| Median | 5722.56 |
| Decile 4 | 5582.06 |
| Decile 3 | 5439.91 |
| Decile 2 | 5276.33 |
| Decile 1 | 5063.97 |
| Minimum | 3264.66 |
|
|
- Mean = 5750.08
- Std.dev = 556.794
- 4 items below graph minimum of 3654.34
- 57 items above graph maximum of 7883.22
|
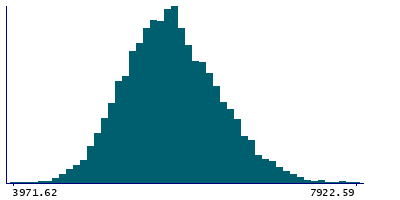
Instance 3 : First repeat imaging visit (2019+)
4,755 participants, 4,755 items
| Maximum | 13672.6 |
| Decile 9 | 6520.34 |
| Decile 8 | 6254.76 |
| Decile 7 | 6058.6 |
| Decile 6 | 5896.89 |
| Median | 5764.23 |
| Decile 4 | 5630.75 |
| Decile 3 | 5489.45 |
| Decile 2 | 5331.83 |
| Decile 1 | 5119.77 |
| Minimum | 3971.62 |
|
|
- Mean = 5798.5
- Std.dev = 567.303
- 5 items above graph maximum of 7920.92
|
Notes
Volume of Whole-thalamus in the left hemisphere generated by subcortical volumetric sub-segmentation of the Thalamic Nuclei
0 Related Data-Fields
There are no related data-fields
0 Resources
There are no matching Resources
