Data
87,996 items of data are available, covering 83,313 participants.
Defined-instances run from 2 to 3, labelled using Instancing
2.
Units of measurement are mm3.
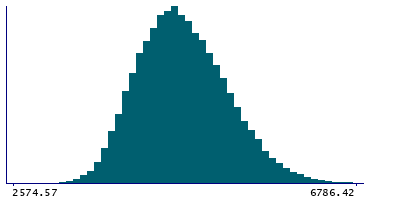
| Maximum | 10890.3 |
| Decile 9 | 5335.52 |
| Decile 8 | 5068.27 |
| Decile 7 | 4878.24 |
| Decile 6 | 4716.51 |
| Median | 4572.42 |
| Decile 4 | 4434.76 |
| Decile 3 | 4295.66 |
| Decile 2 | 4140.81 |
| Decile 1 | 3944.96 |
| Minimum | 2003.76 |
|
|
- Mean = 4613.2
- Std.dev = 544.066
- 3 items below graph minimum of 2554.4
- 53 items above graph maximum of 6726.08
|
2 Instances
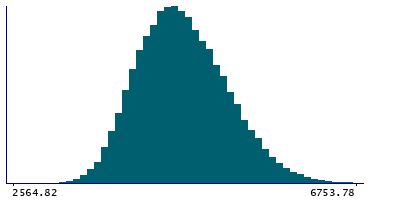
Instance 2 : Imaging visit (2014+)
83,241 participants, 83,241 items
| Maximum | 10890.3 |
| Decile 9 | 5334.52 |
| Decile 8 | 5066.87 |
| Decile 7 | 4876.4 |
| Decile 6 | 4714.49 |
| Median | 4570.62 |
| Decile 4 | 4433.26 |
| Decile 3 | 4294.13 |
| Decile 2 | 4139.25 |
| Decile 1 | 3944.53 |
| Minimum | 2003.76 |
|
|
- Mean = 4611.74
- Std.dev = 543.896
- 3 items below graph minimum of 2554.54
- 51 items above graph maximum of 6724.51
|
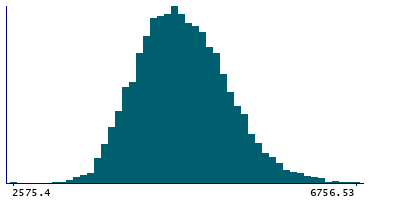
Instance 3 : First repeat imaging visit (2019+)
4,755 participants, 4,755 items
| Maximum | 6871.59 |
| Decile 9 | 5353.77 |
| Decile 8 | 5089.42 |
| Decile 7 | 4910.27 |
| Decile 6 | 4754.43 |
| Median | 4606.09 |
| Decile 4 | 4467.95 |
| Decile 3 | 4320.87 |
| Decile 2 | 4163.03 |
| Decile 1 | 3952.6 |
| Minimum | 2575.4 |
|
|
- Mean = 4638.73
- Std.dev = 546.416
- 1 item above graph maximum of 6754.94
|
Notes
Volume of Medulla in the whole brain generated by subcortical volumetric sub-segmentation of the Brainstem
0 Related Data-Fields
There are no related data-fields
0 Resources
There are no matching Resources
