Data
87,996 items of data are available, covering 83,313 participants.
Defined-instances run from 2 to 3, labelled using Instancing
2.
Units of measurement are mm.
| Maximum | 3.759 |
| Decile 9 | 3.111 |
| Decile 8 | 3.033 |
| Decile 7 | 2.977 |
| Decile 6 | 2.928 |
| Median | 2.882 |
| Decile 4 | 2.836 |
| Decile 3 | 2.787 |
| Decile 2 | 2.728 |
| Decile 1 | 2.642 |
| Minimum | 1.175 |
|
|
- Mean = 2.87822
- Std.dev = 0.186945
- 74 items below graph minimum of 2.173
- 8 items above graph maximum of 3.58
|
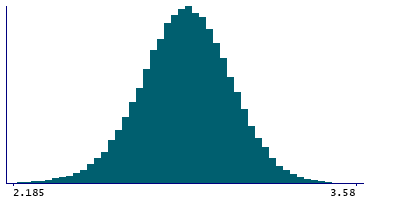
2 Instances
Instance 2 : Imaging visit (2014+)
83,241 participants, 83,241 items
| Maximum | 3.759 |
| Decile 9 | 3.111 |
| Decile 8 | 3.033 |
| Decile 7 | 2.976 |
| Decile 6 | 2.927 |
| Median | 2.881 |
| Decile 4 | 2.835 |
| Decile 3 | 2.785 |
| Decile 2 | 2.726 |
| Decile 1 | 2.64 |
| Minimum | 1.612 |
|

|
- Mean = 2.87717
- Std.dev = 0.187423
- 68 items below graph minimum of 2.169
- 8 items above graph maximum of 3.582
|
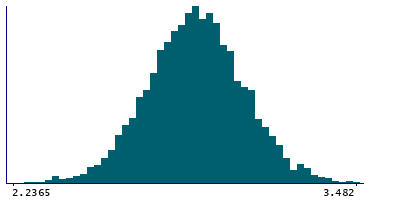
Instance 3 : First repeat imaging visit (2019+)
4,755 participants, 4,755 items
| Maximum | 3.482 |
| Decile 9 | 3.117 |
| Decile 8 | 3.041 |
| Decile 7 | 2.987 |
| Decile 6 | 2.942 |
| Median | 2.898 |
| Decile 4 | 2.855 |
| Decile 3 | 2.8085 |
| Decile 2 | 2.754 |
| Decile 1 | 2.677 |
| Minimum | 1.175 |
|
|
- Mean = 2.8965
- Std.dev = 0.177372
- 6 items below graph minimum of 2.237
|
Notes
Mean thickness of parsorbitalis in the right hemisphere generated by parcellation of the white surface using Desikan-Killiany parcellation
0 Related Data-Fields
There are no related data-fields
0 Resources
There are no matching Resources
