Data
87,996 items of data are available, covering 83,313 participants.
Defined-instances run from 2 to 3, labelled using Instancing
2.
Units of measurement are mm.
| Maximum | 3.367 |
| Decile 9 | 2.964 |
| Decile 8 | 2.894 |
| Decile 7 | 2.841 |
| Decile 6 | 2.794 |
| Median | 2.748 |
| Decile 4 | 2.697 |
| Decile 3 | 2.641 |
| Decile 2 | 2.572 |
| Decile 1 | 2.465 |
| Minimum | 1.533 |
|

|
- Mean = 2.72742
- Std.dev = 0.1988
- 94 items below graph minimum of 1.966
|
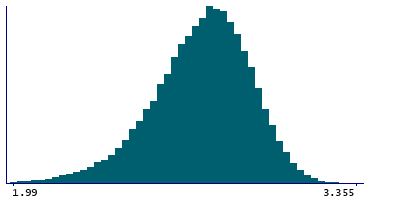
2 Instances
Instance 2 : Imaging visit (2014+)
83,241 participants, 83,241 items
| Maximum | 3.367 |
| Decile 9 | 2.963 |
| Decile 8 | 2.893 |
| Decile 7 | 2.84 |
| Decile 6 | 2.792 |
| Median | 2.746 |
| Decile 4 | 2.695 |
| Decile 3 | 2.639 |
| Decile 2 | 2.569 |
| Decile 1 | 2.463 |
| Minimum | 1.533 |
|
|
- Mean = 2.72599
- Std.dev = 0.199325
- 86 items below graph minimum of 1.963
|
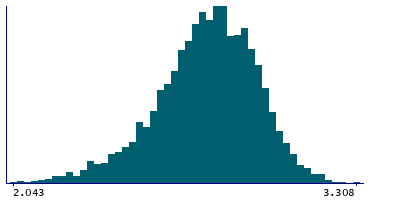
Instance 3 : First repeat imaging visit (2019+)
4,755 participants, 4,755 items
| Maximum | 3.308 |
| Decile 9 | 2.973 |
| Decile 8 | 2.909 |
| Decile 7 | 2.86 |
| Decile 6 | 2.813 |
| Median | 2.769 |
| Decile 4 | 2.724 |
| Decile 3 | 2.6735 |
| Decile 2 | 2.61 |
| Decile 1 | 2.508 |
| Minimum | 1.63 |
|
|
- Mean = 2.75259
- Std.dev = 0.187604
- 8 items below graph minimum of 2.043
|
Notes
Mean thickness of precentral in the right hemisphere generated by parcellation of the white surface using Desikan-Killiany parcellation
0 Related Data-Fields
There are no related data-fields
0 Resources
There are no matching Resources
