Data
87,996 items of data are available, covering 83,313 participants.
Defined-instances run from 2 to 3, labelled using Instancing
2.
Units of measurement are mm2.
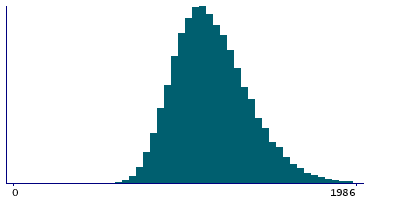
| Maximum | 2213 |
| Decile 9 | 1434 |
| Decile 8 | 1318 |
| Decile 7 | 1240 |
| Decile 6 | 1178 |
| Median | 1122 |
| Decile 4 | 1070 |
| Decile 3 | 1017 |
| Decile 2 | 959 |
| Decile 1 | 885 |
| Minimum | 439 |
|
|
- Mean = 1144.02
- Std.dev = 215.039
- 49 items above graph maximum of 1983
|
2 Instances
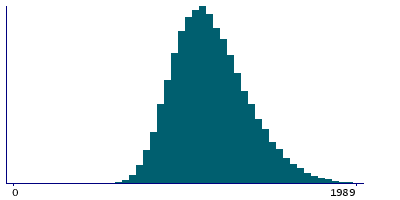
Instance 2 : Imaging visit (2014+)
83,241 participants, 83,241 items
| Maximum | 2213 |
| Decile 9 | 1435 |
| Decile 8 | 1318 |
| Decile 7 | 1240 |
| Decile 6 | 1177 |
| Median | 1122 |
| Decile 4 | 1069 |
| Decile 3 | 1016 |
| Decile 2 | 958 |
| Decile 1 | 885 |
| Minimum | 504 |
|
|
- Mean = 1143.64
- Std.dev = 215.094
- 44 items above graph maximum of 1985
|
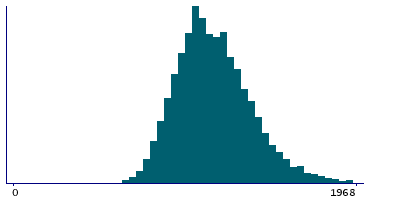
Instance 3 : First repeat imaging visit (2019+)
4,755 participants, 4,755 items
| Maximum | 2123 |
| Decile 9 | 1431 |
| Decile 8 | 1320 |
| Decile 7 | 1244 |
| Decile 6 | 1187 |
| Median | 1128 |
| Decile 4 | 1075 |
| Decile 3 | 1026 |
| Decile 2 | 969 |
| Decile 1 | 894 |
| Minimum | 439 |
|
|
- Mean = 1150.77
- Std.dev = 213.968
- 4 items above graph maximum of 1968
|
Notes
Area of pericalcarine in the left hemisphere generated by parcellation of the pial surface using Desikan-Killiany parcellation
0 Related Data-Fields
There are no related data-fields
0 Resources
There are no matching Resources
