Data
87,996 items of data are available, covering 83,313 participants.
Defined-instances run from 2 to 3, labelled using Instancing
2.
Units of measurement are mm2.
| Maximum | 3880 |
| Decile 9 | 2880 |
| Decile 8 | 2745 |
| Decile 7 | 2652 |
| Decile 6 | 2575 |
| Median | 2505 |
| Decile 4 | 2437 |
| Decile 3 | 2367 |
| Decile 2 | 2287 |
| Decile 1 | 2183 |
| Minimum | 1561 |
|
|
- Mean = 2520.8
- Std.dev = 273.955
- 43 items above graph maximum of 3577
|
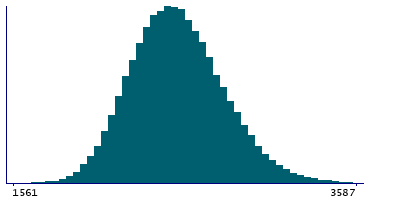
2 Instances
Instance 2 : Imaging visit (2014+)
83,241 participants, 83,241 items
| Maximum | 3880 |
| Decile 9 | 2879 |
| Decile 8 | 2743 |
| Decile 7 | 2651 |
| Decile 6 | 2573 |
| Median | 2503 |
| Decile 4 | 2435 |
| Decile 3 | 2365 |
| Decile 2 | 2286 |
| Decile 1 | 2182 |
| Minimum | 1561 |
|

|
- Mean = 2519.21
- Std.dev = 273.809
- 42 items above graph maximum of 3576
|
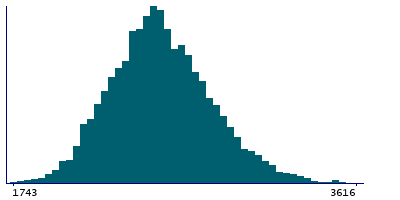
Instance 3 : First repeat imaging visit (2019+)
4,755 participants, 4,755 items
| Maximum | 3752 |
| Decile 9 | 2910.5 |
| Decile 8 | 2772 |
| Decile 7 | 2680 |
| Decile 6 | 2600 |
| Median | 2531 |
| Decile 4 | 2471 |
| Decile 3 | 2399 |
| Decile 2 | 2314 |
| Decile 1 | 2205 |
| Minimum | 1743 |
|
|
- Mean = 2548.64
- Std.dev = 275.005
- 1 item above graph maximum of 3616
|
Notes
Area of medialorbitofrontal in the right hemisphere generated by parcellation of the pial surface using Desikan-Killiany parcellation
0 Related Data-Fields
There are no related data-fields
0 Resources
There are no matching Resources
