Data
87,996 items of data are available, covering 83,313 participants.
Defined-instances run from 2 to 3, labelled using Instancing
2.
Units of measurement are AU.
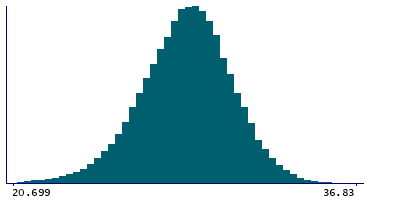
| Maximum | 37.8726 |
| Decile 9 | 31.3116 |
| Decile 8 | 30.4424 |
| Decile 7 | 29.8259 |
| Decile 6 | 29.2913 |
| Median | 28.7742 |
| Decile 4 | 28.2362 |
| Decile 3 | 27.6464 |
| Decile 2 | 26.9222 |
| Decile 1 | 25.8587 |
| Minimum | 15.8978 |
|
|
- Mean = 28.6553
- Std.dev = 2.16931
- 80 items below graph minimum of 20.4058
- 3 items above graph maximum of 36.7645
|
2 Instances
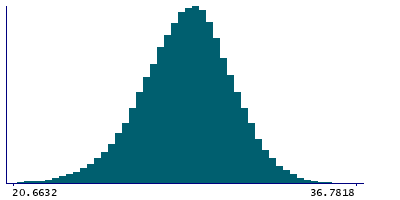
Instance 2 : Imaging visit (2014+)
83,241 participants, 83,241 items
| Maximum | 37.0035 |
| Decile 9 | 31.322 |
| Decile 8 | 30.4474 |
| Decile 7 | 29.8225 |
| Decile 6 | 29.2886 |
| Median | 28.7672 |
| Decile 4 | 28.2268 |
| Decile 3 | 27.6358 |
| Decile 2 | 26.9072 |
| Decile 1 | 25.8404 |
| Minimum | 15.8978 |
|
|
- Mean = 28.6502
- Std.dev = 2.17922
- 73 items below graph minimum of 20.3588
- 2 items above graph maximum of 36.8036
|
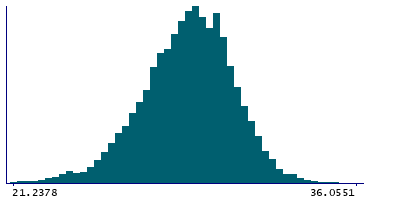
Instance 3 : First repeat imaging visit (2019+)
4,755 participants, 4,755 items
| Maximum | 37.8726 |
| Decile 9 | 31.116 |
| Decile 8 | 30.3634 |
| Decile 7 | 29.8747 |
| Decile 6 | 29.3467 |
| Median | 28.8747 |
| Decile 4 | 28.3964 |
| Decile 3 | 27.8171 |
| Decile 2 | 27.1889 |
| Decile 1 | 26.1769 |
| Minimum | 16.9404 |
|
|
- Mean = 28.7439
- Std.dev = 1.98572
- 6 items below graph minimum of 21.2378
- 1 item above graph maximum of 36.0551
|
Notes
Grey-white contrast in supramarginal in the left hemisphere calculated as a percentage of the mean gray-white matter intensity from Desikan-Killiany parcellation
0 Related Data-Fields
There are no related data-fields
0 Resources
There are no matching Resources
