Data
87,996 items of data are available, covering 83,313 participants.
Defined-instances run from 2 to 3, labelled using Instancing
2.
Units of measurement are AU.
| Maximum | 35.2776 |
| Decile 9 | 28.0778 |
| Decile 8 | 27.2227 |
| Decile 7 | 26.6337 |
| Decile 6 | 26.1281 |
| Median | 25.6729 |
| Decile 4 | 25.2213 |
| Decile 3 | 24.7321 |
| Decile 2 | 24.1577 |
| Decile 1 | 23.3252 |
| Minimum | 13.919 |
|

|
- Mean = 25.6967
- Std.dev = 1.89006
- 28 items below graph minimum of 18.5725
- 54 items above graph maximum of 32.8305
|
2 Instances
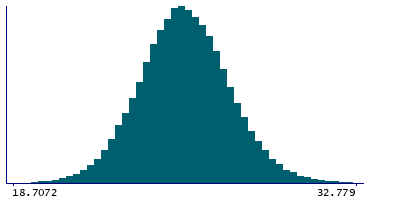
Instance 2 : Imaging visit (2014+)
83,241 participants, 83,241 items
| Maximum | 35.2776 |
| Decile 9 | 28.0492 |
| Decile 8 | 27.2024 |
| Decile 7 | 26.6133 |
| Decile 6 | 26.1078 |
| Median | 25.6517 |
| Decile 4 | 25.2016 |
| Decile 3 | 24.7106 |
| Decile 2 | 24.1362 |
| Decile 1 | 23.3041 |
| Minimum | 13.919 |
|
|
- Mean = 25.6742
- Std.dev = 1.88763
- 26 items below graph minimum of 18.559
- 53 items above graph maximum of 32.7943
|
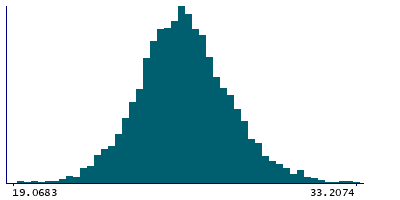
Instance 3 : First repeat imaging visit (2019+)
4,755 participants, 4,755 items
| Maximum | 34.0335 |
| Decile 9 | 28.4944 |
| Decile 8 | 27.6156 |
| Decile 7 | 26.9653 |
| Decile 6 | 26.4667 |
| Median | 26.0315 |
| Decile 4 | 25.5979 |
| Decile 3 | 25.1034 |
| Decile 2 | 24.5794 |
| Decile 1 | 23.7813 |
| Minimum | 15.9685 |
|
|
- Mean = 26.0893
- Std.dev = 1.88944
- 2 items below graph minimum of 19.0683
- 1 item above graph maximum of 33.2074
|
Notes
Grey-white contrast in lateraloccipital in the right hemisphere calculated as a percentage of the mean gray-white matter intensity from Desikan-Killiany parcellation
0 Related Data-Fields
There are no related data-fields
0 Resources
There are no matching Resources
