Data
87,996 items of data are available, covering 83,313 participants.
Defined-instances run from 2 to 3, labelled using Instancing
2.
Units of measurement are AU.
| Maximum | 31.9409 |
| Decile 9 | 23.5107 |
| Decile 8 | 22.6574 |
| Decile 7 | 22.0509 |
| Decile 6 | 21.5508 |
| Median | 21.0687 |
| Decile 4 | 20.6001 |
| Decile 3 | 20.0926 |
| Decile 2 | 19.5151 |
| Decile 1 | 18.7271 |
| Minimum | 11.9146 |
|
|
- Mean = 21.0996
- Std.dev = 1.87907
- 8 items below graph minimum of 13.9435
- 18 items above graph maximum of 28.2943
|
2 Instances
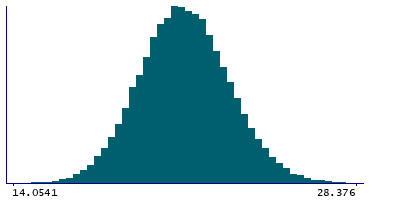
Instance 2 : Imaging visit (2014+)
83,241 participants, 83,241 items
| Maximum | 31.9409 |
| Decile 9 | 23.5296 |
| Decile 8 | 22.6675 |
| Decile 7 | 22.0562 |
| Decile 6 | 21.553 |
| Median | 21.0676 |
| Decile 4 | 20.5976 |
| Decile 3 | 20.089 |
| Decile 2 | 19.5108 |
| Decile 1 | 18.7222 |
| Minimum | 11.9146 |
|

|
- Mean = 21.1025
- Std.dev = 1.88739
- 6 items below graph minimum of 13.9148
- 18 items above graph maximum of 28.337
|
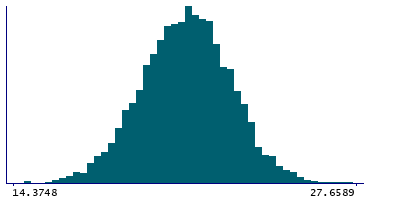
Instance 3 : First repeat imaging visit (2019+)
4,755 participants, 4,755 items
| Maximum | 27.9336 |
| Decile 9 | 23.2309 |
| Decile 8 | 22.5135 |
| Decile 7 | 21.9732 |
| Decile 6 | 21.5243 |
| Median | 21.0875 |
| Decile 4 | 20.6418 |
| Decile 3 | 20.1621 |
| Decile 2 | 19.5938 |
| Decile 1 | 18.8028 |
| Minimum | 13.2859 |
|
|
- Mean = 21.0486
- Std.dev = 1.72602
- 1 item below graph minimum of 14.3748
- 1 item above graph maximum of 27.6589
|
Notes
Grey-white contrast in precentral in the right hemisphere calculated as a percentage of the mean gray-white matter intensity from Desikan-Killiany parcellation
0 Related Data-Fields
There are no related data-fields
0 Resources
There are no matching Resources
