Data
87,996 items of data are available, covering 83,313 participants.
Defined-instances run from 2 to 3, labelled using Instancing
2.
Units of measurement are mm2.
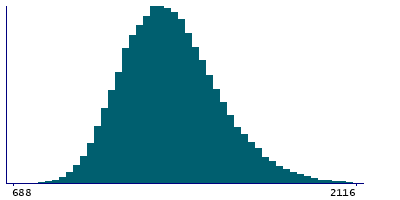
| Maximum | 2504 |
| Decile 9 | 1602 |
| Decile 8 | 1499 |
| Decile 7 | 1429 |
| Decile 6 | 1373 |
| Median | 1322 |
| Decile 4 | 1273 |
| Decile 3 | 1223 |
| Decile 2 | 1167 |
| Decile 1 | 1096 |
| Minimum | 688 |
|
|
- Mean = 1338.03
- Std.dev = 199.651
- 69 items above graph maximum of 2108
|
2 Instances
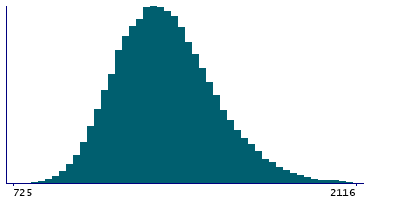
Instance 2 : Imaging visit (2014+)
83,241 participants, 83,241 items
| Maximum | 2504 |
| Decile 9 | 1602 |
| Decile 8 | 1498 |
| Decile 7 | 1428 |
| Decile 6 | 1373 |
| Median | 1322 |
| Decile 4 | 1273 |
| Decile 3 | 1222 |
| Decile 2 | 1166 |
| Decile 1 | 1095 |
| Minimum | 725 |
|
|
- Mean = 1337.6
- Std.dev = 199.667
- 63 items above graph maximum of 2109
|
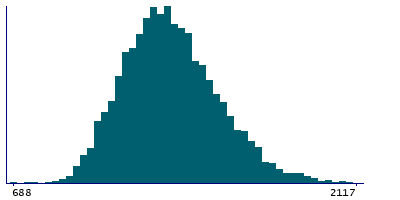
Instance 3 : First repeat imaging visit (2019+)
4,755 participants, 4,755 items
| Maximum | 2383 |
| Decile 9 | 1610 |
| Decile 8 | 1504 |
| Decile 7 | 1435 |
| Decile 6 | 1380 |
| Median | 1329 |
| Decile 4 | 1281 |
| Decile 3 | 1233.5 |
| Decile 2 | 1174 |
| Decile 1 | 1103 |
| Minimum | 688 |
|
|
- Mean = 1345.43
- Std.dev = 199.228
- 5 items above graph maximum of 2117
|
Notes
Area of MT in the left hemisphere generated by parcellation of the white surface using BA_exvivo parcellation
0 Related Data-Fields
There are no related data-fields
0 Resources
There are no matching Resources
