Data
87,996 items of data are available, covering 83,313 participants.
Defined-instances run from 2 to 3, labelled using Instancing
2.
Units of measurement are mm3.
| Maximum | 3501 |
| Decile 9 | 1277 |
| Decile 8 | 1211 |
| Decile 7 | 1166 |
| Decile 6 | 1129 |
| Median | 1095 |
| Decile 4 | 1062 |
| Decile 3 | 1028 |
| Decile 2 | 989 |
| Decile 1 | 937 |
| Minimum | 623 |
|
|
- Mean = 1102.99
- Std.dev = 136.24
- 143 items above graph maximum of 1617
|
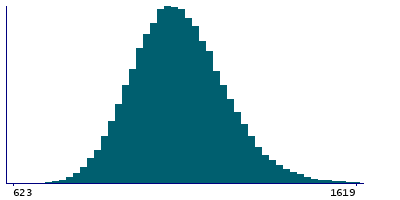
2 Instances
Instance 2 : Imaging visit (2014+)
83,241 participants, 83,241 items
| Maximum | 3501 |
| Decile 9 | 1276 |
| Decile 8 | 1210 |
| Decile 7 | 1166 |
| Decile 6 | 1129 |
| Median | 1095 |
| Decile 4 | 1062 |
| Decile 3 | 1028 |
| Decile 2 | 989 |
| Decile 1 | 937 |
| Minimum | 623 |
|

|
- Mean = 1102.71
- Std.dev = 136.378
- 139 items above graph maximum of 1615
|
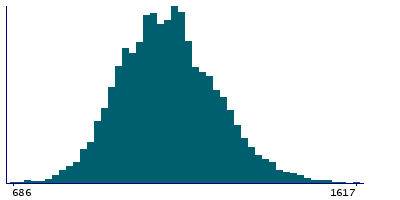
Instance 3 : First repeat imaging visit (2019+)
4,755 participants, 4,755 items
| Maximum | 1959 |
| Decile 9 | 1281 |
| Decile 8 | 1218 |
| Decile 7 | 1169.5 |
| Decile 6 | 1134 |
| Median | 1102 |
| Decile 4 | 1067 |
| Decile 3 | 1034 |
| Decile 2 | 993 |
| Decile 1 | 945 |
| Minimum | 686 |
|
|
- Mean = 1107.73
- Std.dev = 133.709
- 6 items above graph maximum of 1617
|
Notes
Volume of BA3a in the right hemisphere generated by parcellation of the white surface using BA_exvivo parcellation
0 Related Data-Fields
There are no related data-fields
0 Resources
There are no matching Resources
