Data
87,996 items of data are available, covering 83,313 participants.
Defined-instances run from 2 to 3, labelled using Instancing
2.
Units of measurement are mm2.
| Maximum | 5045 |
| Decile 9 | 3626 |
| Decile 8 | 3433 |
| Decile 7 | 3296 |
| Decile 6 | 3184 |
| Median | 3081 |
| Decile 4 | 2980 |
| Decile 3 | 2872 |
| Decile 2 | 2750 |
| Decile 1 | 2586 |
| Minimum | 1146 |
|

|
- Mean = 3096.35
- Std.dev = 407.25
- 5 items below graph minimum of 1546
- 17 items above graph maximum of 4666
|
2 Instances
Instance 2 : Imaging visit (2014+)
83,241 participants, 83,241 items
| Maximum | 5045 |
| Decile 9 | 3625.5 |
| Decile 8 | 3432 |
| Decile 7 | 3296 |
| Decile 6 | 3183 |
| Median | 3079 |
| Decile 4 | 2979 |
| Decile 3 | 2870 |
| Decile 2 | 2749 |
| Decile 1 | 2585 |
| Minimum | 1146 |
|

|
- Mean = 3095.31
- Std.dev = 407.567
- 4 items below graph minimum of 1544.5
- 16 items above graph maximum of 4666
|
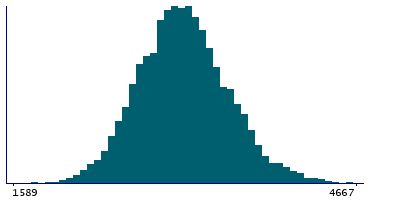
Instance 3 : First repeat imaging visit (2019+)
4,755 participants, 4,755 items
| Maximum | 4698 |
| Decile 9 | 3641 |
| Decile 8 | 3445 |
| Decile 7 | 3305.5 |
| Decile 6 | 3198 |
| Median | 3103 |
| Decile 4 | 3003 |
| Decile 3 | 2903 |
| Decile 2 | 2774 |
| Decile 1 | 2615 |
| Minimum | 1181 |
|
|
- Mean = 3114.56
- Std.dev = 401.222
- 1 item below graph minimum of 1589
- 1 item above graph maximum of 4667
|
Notes
Area of lingual in the left hemisphere generated by parcellation of the white surface using DKT parcellation
0 Related Data-Fields
There are no related data-fields
0 Resources
There are no matching Resources
