Data
87,996 items of data are available, covering 83,313 participants.
Defined-instances run from 2 to 3, labelled using Instancing
2.
Units of measurement are mm2.
| Maximum | 8039 |
| Decile 9 | 5737 |
| Decile 8 | 5465 |
| Decile 7 | 5273 |
| Decile 6 | 5121 |
| Median | 4978 |
| Decile 4 | 4845 |
| Decile 3 | 4707 |
| Decile 2 | 4554 |
| Decile 1 | 4352 |
| Minimum | 3171 |
|
|
- Mean = 5017.92
- Std.dev = 543.899
- 47 items above graph maximum of 7122
|
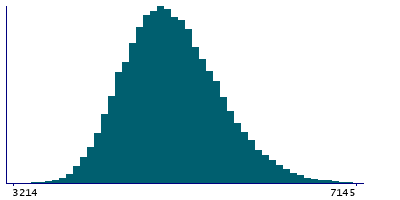
2 Instances
Instance 2 : Imaging visit (2014+)
83,241 participants, 83,241 items
| Maximum | 8039 |
| Decile 9 | 5734 |
| Decile 8 | 5463 |
| Decile 7 | 5271 |
| Decile 6 | 5120 |
| Median | 4976 |
| Decile 4 | 4844 |
| Decile 3 | 4706 |
| Decile 2 | 4552 |
| Decile 1 | 4351 |
| Minimum | 3171 |
|

|
- Mean = 5016.08
- Std.dev = 543.39
- 48 items above graph maximum of 7117
|
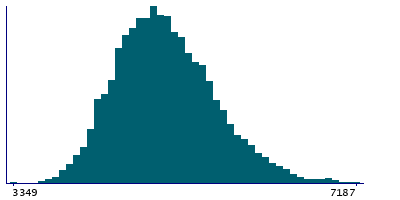
Instance 3 : First repeat imaging visit (2019+)
4,755 participants, 4,755 items
| Maximum | 7187 |
| Decile 9 | 5785 |
| Decile 8 | 5500 |
| Decile 7 | 5308 |
| Decile 6 | 5146 |
| Median | 5005 |
| Decile 4 | 4870 |
| Decile 3 | 4730.5 |
| Decile 2 | 4575 |
| Decile 1 | 4379 |
| Minimum | 3349 |
|
|
- Mean = 5050.11
- Std.dev = 551.737
|
Notes
Area of superiortemporal in the left hemisphere generated by parcellation of the white surface using DKT parcellation
0 Related Data-Fields
There are no related data-fields
0 Resources
There are no matching Resources
