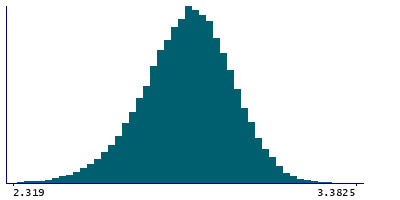
Data
87,996 items of data are available, covering 83,313 participants.
Defined-instances run from 2 to 3, labelled using Instancing
2.
Units of measurement are mm.
| Maximum | 3.391 |
| Decile 9 | 3.024 |
| Decile 8 | 2.968 |
| Decile 7 | 2.927 |
| Decile 6 | 2.891 |
| Median | 2.857 |
| Decile 4 | 2.821 |
| Decile 3 | 2.782 |
| Decile 2 | 2.734 |
| Decile 1 | 2.664 |
| Minimum | 1.792 |
|
|
- Mean = 2.84871
- Std.dev = 0.143021
- 107 items below graph minimum of 2.304
- 1 item above graph maximum of 3.384
|
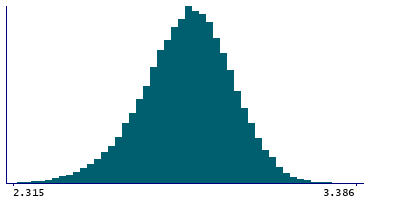
2 Instances
Instance 2 : Imaging visit (2014+)
83,241 participants, 83,241 items
| Maximum | 3.391 |
| Decile 9 | 3.0235 |
| Decile 8 | 2.967 |
| Decile 7 | 2.926 |
| Decile 6 | 2.89 |
| Median | 2.857 |
| Decile 4 | 2.821 |
| Decile 3 | 2.7815 |
| Decile 2 | 2.733 |
| Decile 1 | 2.663 |
| Minimum | 1.792 |
|
|
- Mean = 2.84803
- Std.dev = 0.143483
- 102 items below graph minimum of 2.3025
- 1 item above graph maximum of 3.384
|
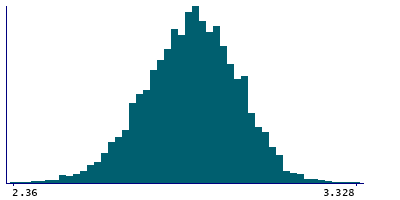
Instance 3 : First repeat imaging visit (2019+)
4,755 participants, 4,755 items
| Maximum | 3.328 |
| Decile 9 | 3.024 |
| Decile 8 | 2.973 |
| Decile 7 | 2.933 |
| Decile 6 | 2.898 |
| Median | 2.865 |
| Decile 4 | 2.833 |
| Decile 3 | 2.796 |
| Decile 2 | 2.751 |
| Decile 1 | 2.692 |
| Minimum | 1.874 |
|
|
- Mean = 2.86067
- Std.dev = 0.134104
- 4 items below graph minimum of 2.36
|
Notes
Mean thickness of fusiform in the left hemisphere generated by parcellation of the white surface using DKT parcellation
0 Related Data-Fields
There are no related data-fields
0 Resources
There are no matching Resources
