Data
87,996 items of data are available, covering 83,313 participants.
Defined-instances run from 2 to 3, labelled using Instancing
2.
Units of measurement are mm.
| Maximum | 3.385 |
| Decile 9 | 2.686 |
| Decile 8 | 2.596 |
| Decile 7 | 2.535 |
| Decile 6 | 2.485 |
| Median | 2.44 |
| Decile 4 | 2.395 |
| Decile 3 | 2.348 |
| Decile 2 | 2.294 |
| Decile 1 | 2.22 |
| Minimum | 1.323 |
|

|
- Mean = 2.44732
- Std.dev = 0.184402
- 17 items below graph minimum of 1.754
- 33 items above graph maximum of 3.152
|
2 Instances
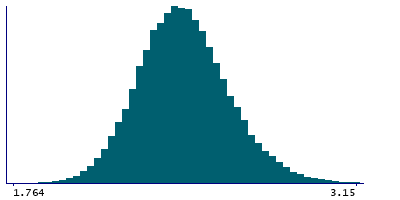
Instance 2 : Imaging visit (2014+)
83,241 participants, 83,241 items
| Maximum | 3.385 |
| Decile 9 | 2.686 |
| Decile 8 | 2.596 |
| Decile 7 | 2.535 |
| Decile 6 | 2.485 |
| Median | 2.439 |
| Decile 4 | 2.394 |
| Decile 3 | 2.347 |
| Decile 2 | 2.294 |
| Decile 1 | 2.219 |
| Minimum | 1.323 |
|
|
- Mean = 2.44692
- Std.dev = 0.184618
- 14 items below graph minimum of 1.752
- 30 items above graph maximum of 3.153
|
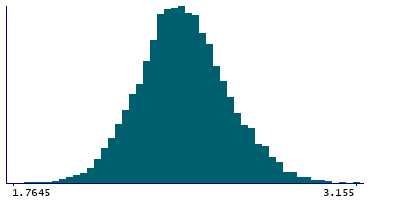
Instance 3 : First repeat imaging visit (2019+)
4,755 participants, 4,755 items
| Maximum | 3.257 |
| Decile 9 | 2.6915 |
| Decile 8 | 2.602 |
| Decile 7 | 2.5415 |
| Decile 6 | 2.493 |
| Median | 2.448 |
| Decile 4 | 2.404 |
| Decile 3 | 2.36 |
| Decile 2 | 2.306 |
| Decile 1 | 2.228 |
| Minimum | 1.641 |
|
|
- Mean = 2.45428
- Std.dev = 0.180432
- 1 item below graph minimum of 1.7645
- 1 item above graph maximum of 3.155
|
Notes
Mean thickness of isthmuscingulate in the left hemisphere generated by parcellation of the white surface using DKT parcellation
0 Related Data-Fields
There are no related data-fields
0 Resources
There are no matching Resources
