Data
87,996 items of data are available, covering 83,313 participants.
Defined-instances run from 2 to 3, labelled using Instancing
2.
Units of measurement are mm.
| Maximum | 3.502 |
| Decile 9 | 2.998 |
| Decile 8 | 2.937 |
| Decile 7 | 2.892 |
| Decile 6 | 2.854 |
| Median | 2.818 |
| Decile 4 | 2.78 |
| Decile 3 | 2.739 |
| Decile 2 | 2.69 |
| Decile 1 | 2.618 |
| Minimum | 1.528 |
|
|
- Mean = 2.81178
- Std.dev = 0.150626
- 51 items below graph minimum of 2.238
- 6 items above graph maximum of 3.378
|
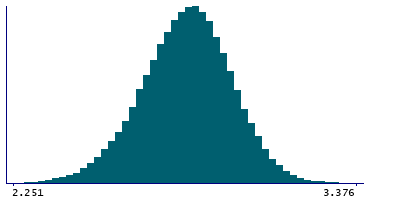
2 Instances
Instance 2 : Imaging visit (2014+)
83,241 participants, 83,241 items
| Maximum | 3.502 |
| Decile 9 | 2.997 |
| Decile 8 | 2.936 |
| Decile 7 | 2.892 |
| Decile 6 | 2.854 |
| Median | 2.817 |
| Decile 4 | 2.779 |
| Decile 3 | 2.738 |
| Decile 2 | 2.689 |
| Decile 1 | 2.617 |
| Minimum | 1.528 |
|

|
- Mean = 2.81095
- Std.dev = 0.150906
- 49 items below graph minimum of 2.237
- 6 items above graph maximum of 3.377
|
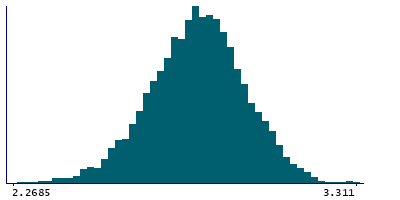
Instance 3 : First repeat imaging visit (2019+)
4,755 participants, 4,755 items
| Maximum | 3.311 |
| Decile 9 | 3.0095 |
| Decile 8 | 2.946 |
| Decile 7 | 2.902 |
| Decile 6 | 2.866 |
| Median | 2.83 |
| Decile 4 | 2.797 |
| Decile 3 | 2.7555 |
| Decile 2 | 2.707 |
| Decile 1 | 2.639 |
| Minimum | 2.225 |
|
|
- Mean = 2.82629
- Std.dev = 0.144861
- 3 items below graph minimum of 2.2685
|
Notes
Mean thickness of lateralorbitofrontal in the left hemisphere generated by parcellation of the white surface using DKT parcellation
0 Related Data-Fields
There are no related data-fields
0 Resources
There are no matching Resources
