Data
87,996 items of data are available, covering 83,313 participants.
Defined-instances run from 2 to 3, labelled using Instancing
2.
Units of measurement are mm.
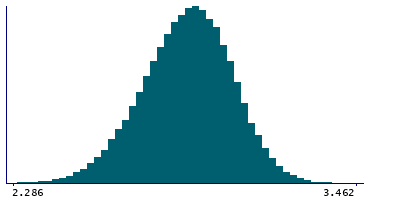
| Maximum | 3.495 |
| Decile 9 | 3.066 |
| Decile 8 | 3.005 |
| Decile 7 | 2.961 |
| Decile 6 | 2.921 |
| Median | 2.882 |
| Decile 4 | 2.843 |
| Decile 3 | 2.799 |
| Decile 2 | 2.748 |
| Decile 1 | 2.672 |
| Minimum | 1.917 |
|
|
- Mean = 2.87487
- Std.dev = 0.154362
- 39 items below graph minimum of 2.278
- 2 items above graph maximum of 3.46
|
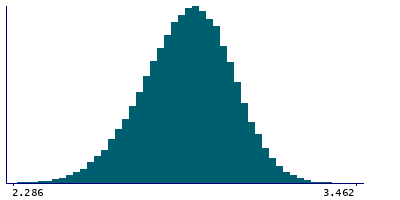
2 Instances
Instance 2 : Imaging visit (2014+)
83,241 participants, 83,241 items
| Maximum | 3.495 |
| Decile 9 | 3.066 |
| Decile 8 | 3.005 |
| Decile 7 | 2.96 |
| Decile 6 | 2.92 |
| Median | 2.882 |
| Decile 4 | 2.842 |
| Decile 3 | 2.799 |
| Decile 2 | 2.747 |
| Decile 1 | 2.671 |
| Minimum | 1.987 |
|
|
- Mean = 2.8745
- Std.dev = 0.154545
- 33 items below graph minimum of 2.276
- 2 items above graph maximum of 3.461
|
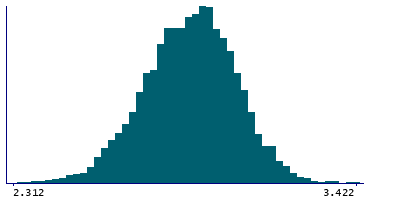
Instance 3 : First repeat imaging visit (2019+)
4,755 participants, 4,755 items
| Maximum | 3.422 |
| Decile 9 | 3.064 |
| Decile 8 | 3.007 |
| Decile 7 | 2.964 |
| Decile 6 | 2.927 |
| Median | 2.889 |
| Decile 4 | 2.849 |
| Decile 3 | 2.807 |
| Decile 2 | 2.758 |
| Decile 1 | 2.688 |
| Minimum | 1.917 |
|
|
- Mean = 2.88135
- Std.dev = 0.150985
- 8 items below graph minimum of 2.312
|
Notes
Mean thickness of middletemporal in the left hemisphere generated by parcellation of the white surface using DKT parcellation
0 Related Data-Fields
There are no related data-fields
0 Resources
There are no matching Resources
