Data
87,996 items of data are available, covering 83,313 participants.
Defined-instances run from 2 to 3, labelled using Instancing
2.
Units of measurement are mm.
| Maximum | 3.061 |
| Decile 9 | 2.499 |
| Decile 8 | 2.44 |
| Decile 7 | 2.396 |
| Decile 6 | 2.358 |
| Median | 2.322 |
| Decile 4 | 2.285 |
| Decile 3 | 2.242 |
| Decile 2 | 2.192 |
| Decile 1 | 2.117 |
| Minimum | 1.573 |
|
|
- Mean = 2.31389
- Std.dev = 0.150971
- 31 items below graph minimum of 1.735
- 10 items above graph maximum of 2.881
|
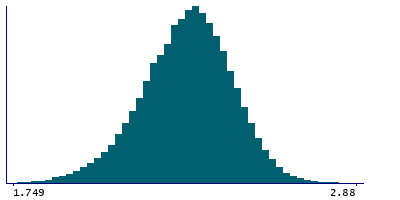
2 Instances
Instance 2 : Imaging visit (2014+)
83,241 participants, 83,241 items
| Maximum | 3.061 |
| Decile 9 | 2.498 |
| Decile 8 | 2.439 |
| Decile 7 | 2.395 |
| Decile 6 | 2.357 |
| Median | 2.321 |
| Decile 4 | 2.284 |
| Decile 3 | 2.241 |
| Decile 2 | 2.191 |
| Decile 1 | 2.116 |
| Minimum | 1.619 |
|

|
- Mean = 2.31297
- Std.dev = 0.151179
- 29 items below graph minimum of 1.734
- 10 items above graph maximum of 2.88
|
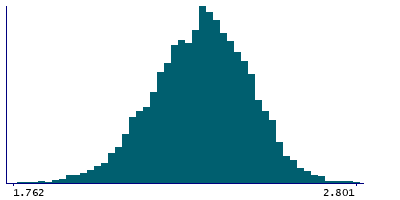
Instance 3 : First repeat imaging visit (2019+)
4,755 participants, 4,755 items
| Maximum | 2.801 |
| Decile 9 | 2.512 |
| Decile 8 | 2.455 |
| Decile 7 | 2.41 |
| Decile 6 | 2.372 |
| Median | 2.337 |
| Decile 4 | 2.299 |
| Decile 3 | 2.256 |
| Decile 2 | 2.21 |
| Decile 1 | 2.137 |
| Minimum | 1.573 |
|
|
- Mean = 2.32984
- Std.dev = 0.146375
- 1 item below graph minimum of 1.762
|
Notes
Mean thickness of postcentral in the left hemisphere generated by parcellation of the white surface using DKT parcellation
0 Related Data-Fields
There are no related data-fields
0 Resources
There are no matching Resources
