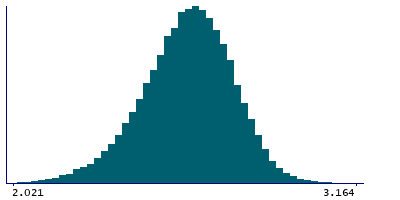
Data
87,996 items of data are available, covering 83,313 participants.
Defined-instances run from 2 to 3, labelled using Instancing
2.
Units of measurement are mm.
| Maximum | 3.255 |
| Decile 9 | 2.779 |
| Decile 8 | 2.721 |
| Decile 7 | 2.677 |
| Decile 6 | 2.638 |
| Median | 2.602 |
| Decile 4 | 2.564 |
| Decile 3 | 2.521 |
| Decile 2 | 2.468 |
| Decile 1 | 2.39 |
| Minimum | 1.848 |
|
|
- Mean = 2.59123
- Std.dev = 0.154667
- 83 items below graph minimum of 2.001
- 2 items above graph maximum of 3.168
|
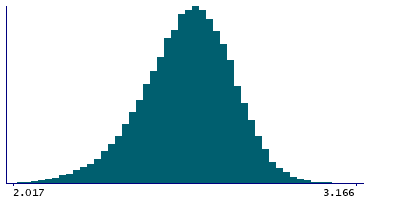
2 Instances
Instance 2 : Imaging visit (2014+)
83,241 participants, 83,241 items
| Maximum | 3.255 |
| Decile 9 | 2.779 |
| Decile 8 | 2.72 |
| Decile 7 | 2.676 |
| Decile 6 | 2.637 |
| Median | 2.601 |
| Decile 4 | 2.563 |
| Decile 3 | 2.52 |
| Decile 2 | 2.466 |
| Decile 1 | 2.388 |
| Minimum | 1.848 |
|
|
- Mean = 2.59023
- Std.dev = 0.15522
- 75 items below graph minimum of 1.997
- 2 items above graph maximum of 3.17
|
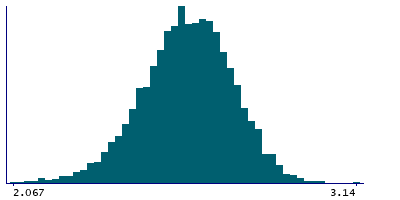
Instance 3 : First repeat imaging visit (2019+)
4,755 participants, 4,755 items
| Maximum | 3.14 |
| Decile 9 | 2.785 |
| Decile 8 | 2.728 |
| Decile 7 | 2.688 |
| Decile 6 | 2.651 |
| Median | 2.614 |
| Decile 4 | 2.58 |
| Decile 3 | 2.542 |
| Decile 2 | 2.494 |
| Decile 1 | 2.426 |
| Minimum | 1.851 |
|
|
- Mean = 2.60869
- Std.dev = 0.143536
- 6 items below graph minimum of 2.067
|
Notes
Mean thickness of precuneus in the left hemisphere generated by parcellation of the white surface using DKT parcellation
0 Related Data-Fields
There are no related data-fields
0 Resources
There are no matching Resources
