Data
87,996 items of data are available, covering 83,313 participants.
Defined-instances run from 2 to 3, labelled using Instancing
2.
Units of measurement are mm3.
| Maximum | 8892 |
| Decile 9 | 4251 |
| Decile 8 | 3993 |
| Decile 7 | 3814 |
| Decile 6 | 3667 |
| Median | 3534 |
| Decile 4 | 3405 |
| Decile 3 | 3267 |
| Decile 2 | 3110 |
| Decile 1 | 2899 |
| Minimum | 894 |
|

|
- Mean = 3558.38
- Std.dev = 539.194
- 22 items below graph minimum of 1547
- 69 items above graph maximum of 5603
|
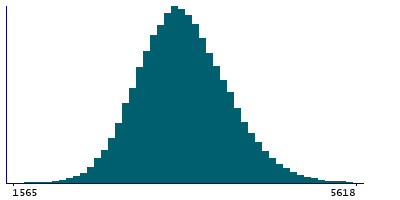
2 Instances
Instance 2 : Imaging visit (2014+)
83,241 participants, 83,241 items
| Maximum | 8892 |
| Decile 9 | 4249 |
| Decile 8 | 3992 |
| Decile 7 | 3811 |
| Decile 6 | 3665 |
| Median | 3532 |
| Decile 4 | 3403 |
| Decile 3 | 3265 |
| Decile 2 | 3108 |
| Decile 1 | 2897 |
| Minimum | 894 |
|
|
- Mean = 3556.05
- Std.dev = 539.112
- 22 items below graph minimum of 1545
- 66 items above graph maximum of 5601
|
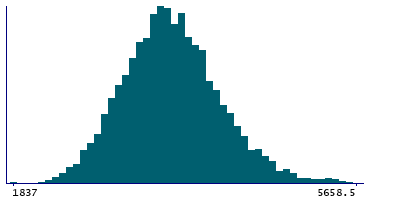
Instance 3 : First repeat imaging visit (2019+)
4,755 participants, 4,755 items
| Maximum | 6117 |
| Decile 9 | 4294 |
| Decile 8 | 4028 |
| Decile 7 | 3853 |
| Decile 6 | 3702 |
| Median | 3566.5 |
| Decile 4 | 3445 |
| Decile 3 | 3309 |
| Decile 2 | 3147 |
| Decile 1 | 2929.5 |
| Minimum | 1837 |
|
|
- Mean = 3599.11
- Std.dev = 538.991
- 3 items above graph maximum of 5658.5
|
Notes
Volume of posteriorcingulate in the left hemisphere generated by parcellation of the white surface using DKT parcellation
0 Related Data-Fields
There are no related data-fields
0 Resources
There are no matching Resources
