Data
87,996 items of data are available, covering 83,313 participants.
Defined-instances run from 2 to 3, labelled using Instancing
2.
Units of measurement are mm2.
| Maximum | 1311 |
| Decile 9 | 471 |
| Decile 8 | 435 |
| Decile 7 | 411 |
| Decile 6 | 391 |
| Median | 373 |
| Decile 4 | 355 |
| Decile 3 | 337 |
| Decile 2 | 317 |
| Decile 1 | 292 |
| Minimum | 69 |
|

|
- Mean = 378.452
- Std.dev = 71.0543
- 131 items above graph maximum of 650
|
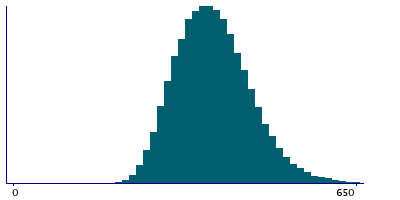
2 Instances
Instance 2 : Imaging visit (2014+)
83,241 participants, 83,241 items
| Maximum | 1311 |
| Decile 9 | 471 |
| Decile 8 | 435 |
| Decile 7 | 411 |
| Decile 6 | 391 |
| Median | 373 |
| Decile 4 | 355 |
| Decile 3 | 337 |
| Decile 2 | 317 |
| Decile 1 | 292 |
| Minimum | 69 |
|
|
- Mean = 378.454
- Std.dev = 71.0146
- 125 items above graph maximum of 650
|
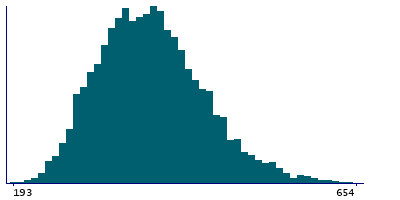
Instance 3 : First repeat imaging visit (2019+)
4,755 participants, 4,755 items
| Maximum | 738 |
| Decile 9 | 472 |
| Decile 8 | 436 |
| Decile 7 | 411 |
| Decile 6 | 391 |
| Median | 373.5 |
| Decile 4 | 355 |
| Decile 3 | 336 |
| Decile 2 | 317 |
| Decile 1 | 290 |
| Minimum | 193 |
|
|
- Mean = 378.413
- Std.dev = 71.7446
- 6 items above graph maximum of 654
|
Notes
Area of entorhinal in the right hemisphere generated by parcellation of the white surface using DKT parcellation
0 Related Data-Fields
There are no related data-fields
0 Resources
There are no matching Resources
