Data
87,996 items of data are available, covering 83,313 participants.
Defined-instances run from 2 to 3, labelled using Instancing
2.
Units of measurement are mm2.
| Maximum | 3472 |
| Decile 9 | 2335 |
| Decile 8 | 2232 |
| Decile 7 | 2162 |
| Decile 6 | 2101 |
| Median | 2047 |
| Decile 4 | 1995 |
| Decile 3 | 1941 |
| Decile 2 | 1880 |
| Decile 1 | 1800 |
| Minimum | 1242 |
|
|
- Mean = 2059.89
- Std.dev = 209.795
- 1 item below graph minimum of 1265
- 52 items above graph maximum of 2870
|
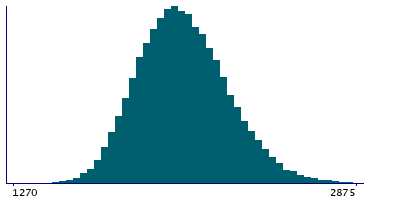
2 Instances
Instance 2 : Imaging visit (2014+)
83,241 participants, 83,241 items
| Maximum | 3472 |
| Decile 9 | 2335 |
| Decile 8 | 2232 |
| Decile 7 | 2161 |
| Decile 6 | 2101 |
| Median | 2047 |
| Decile 4 | 1995 |
| Decile 3 | 1941 |
| Decile 2 | 1879 |
| Decile 1 | 1800 |
| Minimum | 1242 |
|

|
- Mean = 2059.59
- Std.dev = 209.857
- 1 item below graph minimum of 1265
- 46 items above graph maximum of 2870
|
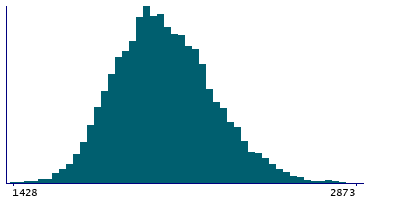
Instance 3 : First repeat imaging visit (2019+)
4,755 participants, 4,755 items
| Maximum | 3039 |
| Decile 9 | 2341 |
| Decile 8 | 2233 |
| Decile 7 | 2166.5 |
| Decile 6 | 2107 |
| Median | 2051 |
| Decile 4 | 1999 |
| Decile 3 | 1949 |
| Decile 2 | 1886 |
| Decile 1 | 1809 |
| Minimum | 1428 |
|
|
- Mean = 2065.26
- Std.dev = 208.641
- 6 items above graph maximum of 2873
|
Notes
Area of insula in the right hemisphere generated by parcellation of the white surface using DKT parcellation
0 Related Data-Fields
There are no related data-fields
0 Resources
There are no matching Resources
