Data
87,996 items of data are available, covering 83,313 participants.
Defined-instances run from 2 to 3, labelled using Instancing
2.
Units of measurement are mm.
| Maximum | 3.486 |
| Decile 9 | 3.035 |
| Decile 8 | 2.974 |
| Decile 7 | 2.93 |
| Decile 6 | 2.892 |
| Median | 2.854 |
| Decile 4 | 2.816 |
| Decile 3 | 2.773 |
| Decile 2 | 2.72 |
| Decile 1 | 2.643 |
| Minimum | 1.736 |
|
|
- Mean = 2.84526
- Std.dev = 0.154614
- 77 items below graph minimum of 2.251
- 1 item above graph maximum of 3.427
|
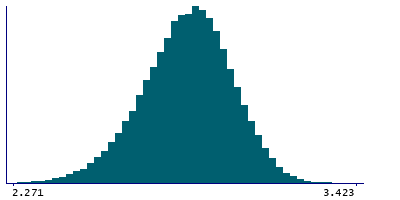
2 Instances
Instance 2 : Imaging visit (2014+)
83,241 participants, 83,241 items
| Maximum | 3.486 |
| Decile 9 | 3.034 |
| Decile 8 | 2.974 |
| Decile 7 | 2.929 |
| Decile 6 | 2.891 |
| Median | 2.853 |
| Decile 4 | 2.815 |
| Decile 3 | 2.772 |
| Decile 2 | 2.719 |
| Decile 1 | 2.642 |
| Minimum | 1.736 |
|

|
- Mean = 2.8441
- Std.dev = 0.155081
- 75 items below graph minimum of 2.25
- 1 item above graph maximum of 3.426
|
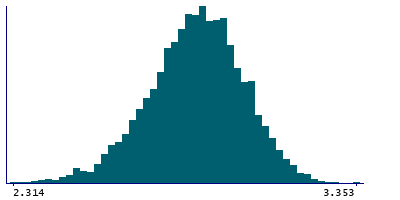
Instance 3 : First repeat imaging visit (2019+)
4,755 participants, 4,755 items
| Maximum | 3.353 |
| Decile 9 | 3.042 |
| Decile 8 | 2.986 |
| Decile 7 | 2.945 |
| Decile 6 | 2.907 |
| Median | 2.874 |
| Decile 4 | 2.838 |
| Decile 3 | 2.798 |
| Decile 2 | 2.751 |
| Decile 1 | 2.678 |
| Minimum | 2.134 |
|
|
- Mean = 2.86558
- Std.dev = 0.144712
- 4 items below graph minimum of 2.314
|
Notes
Mean thickness of fusiform in the right hemisphere generated by parcellation of the white surface using DKT parcellation
0 Related Data-Fields
There are no related data-fields
0 Resources
There are no matching Resources
