Data
87,996 items of data are available, covering 83,313 participants.
Defined-instances run from 2 to 3, labelled using Instancing
2.
Units of measurement are mm.
| Maximum | 3.443 |
| Decile 9 | 2.997 |
| Decile 8 | 2.934 |
| Decile 7 | 2.888 |
| Decile 6 | 2.849 |
| Median | 2.812 |
| Decile 4 | 2.774 |
| Decile 3 | 2.733 |
| Decile 2 | 2.684 |
| Decile 1 | 2.615 |
| Minimum | 1.624 |
|
|
- Mean = 2.80844
- Std.dev = 0.151421
- 35 items below graph minimum of 2.233
- 9 items above graph maximum of 3.379
|
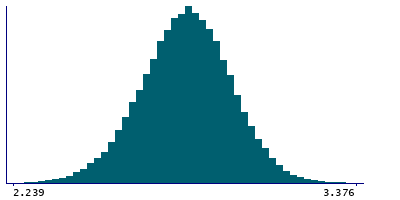
2 Instances
Instance 2 : Imaging visit (2014+)
83,241 participants, 83,241 items
| Maximum | 3.443 |
| Decile 9 | 2.997 |
| Decile 8 | 2.933 |
| Decile 7 | 2.888 |
| Decile 6 | 2.849 |
| Median | 2.812 |
| Decile 4 | 2.774 |
| Decile 3 | 2.732 |
| Decile 2 | 2.683 |
| Decile 1 | 2.614 |
| Minimum | 1.624 |
|

|
- Mean = 2.8078
- Std.dev = 0.151813
- 32 items below graph minimum of 2.231
- 5 items above graph maximum of 3.38
|
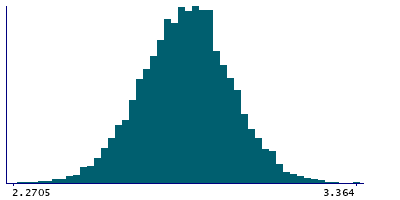
Instance 3 : First repeat imaging visit (2019+)
4,755 participants, 4,755 items
| Maximum | 3.399 |
| Decile 9 | 2.9995 |
| Decile 8 | 2.938 |
| Decile 7 | 2.894 |
| Decile 6 | 2.858 |
| Median | 2.822 |
| Decile 4 | 2.786 |
| Decile 3 | 2.748 |
| Decile 2 | 2.7 |
| Decile 1 | 2.635 |
| Minimum | 2.059 |
|
|
- Mean = 2.81964
- Std.dev = 0.143917
- 1 item below graph minimum of 2.2705
- 2 items above graph maximum of 3.364
|
Notes
Mean thickness of lateralorbitofrontal in the right hemisphere generated by parcellation of the white surface using DKT parcellation
0 Related Data-Fields
There are no related data-fields
0 Resources
There are no matching Resources
