Data
87,996 items of data are available, covering 83,313 participants.
Defined-instances run from 2 to 3, labelled using Instancing
2.
Units of measurement are mm3.
| Maximum | 7983 |
| Decile 9 | 4794 |
| Decile 8 | 4455 |
| Decile 7 | 4226 |
| Decile 6 | 4046 |
| Median | 3882 |
| Decile 4 | 3727 |
| Decile 3 | 3568 |
| Decile 2 | 3391 |
| Decile 1 | 3160 |
| Minimum | 1259 |
|
|
- Mean = 3938.11
- Std.dev = 646.106
- 89 items above graph maximum of 6428
|
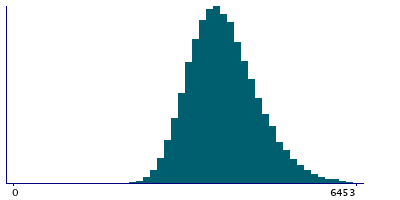
2 Instances
Instance 2 : Imaging visit (2014+)
83,241 participants, 83,241 items
| Maximum | 7983 |
| Decile 9 | 4791 |
| Decile 8 | 4454 |
| Decile 7 | 4224 |
| Decile 6 | 4045 |
| Median | 3881 |
| Decile 4 | 3726 |
| Decile 3 | 3567 |
| Decile 2 | 3389 |
| Decile 1 | 3158 |
| Minimum | 1259 |
|

|
- Mean = 3936.45
- Std.dev = 645.521
- 81 items above graph maximum of 6424
|
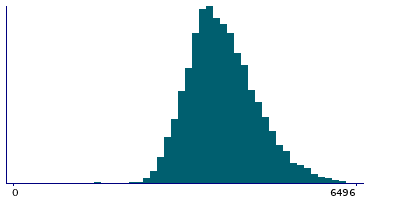
Instance 3 : First repeat imaging visit (2019+)
4,755 participants, 4,755 items
| Maximum | 6830 |
| Decile 9 | 4839 |
| Decile 8 | 4496 |
| Decile 7 | 4257 |
| Decile 6 | 4068 |
| Median | 3900 |
| Decile 4 | 3738 |
| Decile 3 | 3590 |
| Decile 2 | 3421 |
| Decile 1 | 3182 |
| Minimum | 1560 |
|
|
- Mean = 3967.22
- Std.dev = 655.575
- 7 items above graph maximum of 6496
|
Notes
Volume of cuneus in the right hemisphere generated by parcellation of the white surface using DKT parcellation
0 Related Data-Fields
There are no related data-fields
0 Resources
There are no matching Resources
