Data
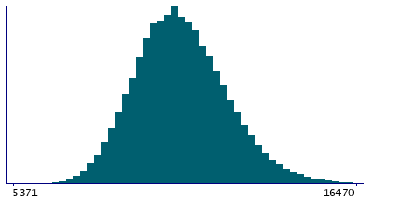
87,996 items of data are available, covering 83,313 participants.
Defined-instances run from 2 to 3, labelled using Instancing
2.
Units of measurement are mm3.
| Maximum | 18606 |
| Decile 9 | 12657 |
| Decile 8 | 11936 |
| Decile 7 | 11434 |
| Decile 6 | 11020 |
| Median | 10642 |
| Decile 4 | 10283 |
| Decile 3 | 9906 |
| Decile 2 | 9491 |
| Decile 1 | 8925 |
| Minimum | 5371 |
|
|
- Mean = 10734.5
- Std.dev = 1469.76
- 61 items above graph maximum of 16389
|
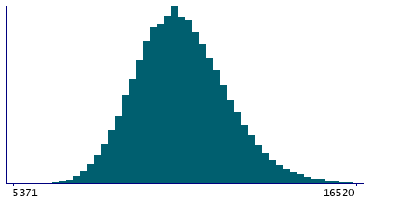
2 Instances
Instance 2 : Imaging visit (2014+)
83,241 participants, 83,241 items
| Maximum | 18606 |
| Decile 9 | 12649 |
| Decile 8 | 11927.5 |
| Decile 7 | 11424 |
| Decile 6 | 11009 |
| Median | 10632 |
| Decile 4 | 10275 |
| Decile 3 | 9898 |
| Decile 2 | 9482 |
| Decile 1 | 8919 |
| Minimum | 5371 |
|
|
- Mean = 10725.9
- Std.dev = 1468.59
- 59 items above graph maximum of 16379
|
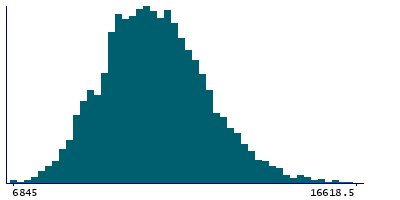
Instance 3 : First repeat imaging visit (2019+)
4,755 participants, 4,755 items
| Maximum | 17956 |
| Decile 9 | 12821.5 |
| Decile 8 | 12091 |
| Decile 7 | 11589.5 |
| Decile 6 | 11194 |
| Median | 10800 |
| Decile 4 | 10427 |
| Decile 3 | 10039.5 |
| Decile 2 | 9644 |
| Decile 1 | 9024.5 |
| Minimum | 6845 |
|
|
- Mean = 10885.2
- Std.dev = 1482.07
- 3 items above graph maximum of 16618.5
|
Notes
Volume of postcentral in the right hemisphere generated by parcellation of the white surface using DKT parcellation
0 Related Data-Fields
There are no related data-fields
0 Resources
There are no matching Resources
