Data
87,996 items of data are available, covering 83,313 participants.
Defined-instances run from 2 to 3, labelled using Instancing
2.
Units of measurement are mm2.
| Maximum | 740 |
| Decile 9 | 267 |
| Decile 8 | 245 |
| Decile 7 | 231 |
| Decile 6 | 220 |
| Median | 210 |
| Decile 4 | 201 |
| Decile 3 | 191 |
| Decile 2 | 180 |
| Decile 1 | 167 |
| Minimum | 7 |
|

|
- Mean = 214.201
- Std.dev = 40.0044
- 149 items above graph maximum of 367
|
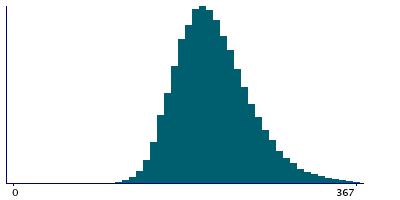
2 Instances
Instance 2 : Imaging visit (2014+)
83,241 participants, 83,241 items
| Maximum | 509 |
| Decile 9 | 267 |
| Decile 8 | 245 |
| Decile 7 | 231 |
| Decile 6 | 220 |
| Median | 210 |
| Decile 4 | 200 |
| Decile 3 | 191 |
| Decile 2 | 180 |
| Decile 1 | 167 |
| Minimum | 7 |
|
|
- Mean = 214.147
- Std.dev = 39.9514
- 136 items above graph maximum of 367
|
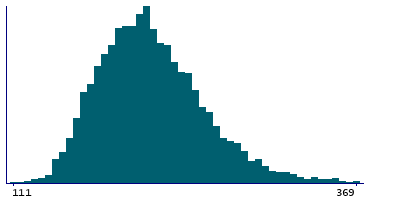
Instance 3 : First repeat imaging visit (2019+)
4,755 participants, 4,755 items
| Maximum | 740 |
| Decile 9 | 267.5 |
| Decile 8 | 246 |
| Decile 7 | 232 |
| Decile 6 | 221 |
| Median | 211 |
| Decile 4 | 202 |
| Decile 3 | 192 |
| Decile 2 | 181 |
| Decile 1 | 167 |
| Minimum | 111 |
|
|
- Mean = 215.148
- Std.dev = 40.91
- 12 items above graph maximum of 368
|
Notes
Area of G-cingul-Post-ventral in the left hemisphere generated by parcellation of the white surface using Destrieux (a2009s) parcellation
0 Related Data-Fields
There are no related data-fields
0 Resources
There are no matching Resources
