Data
87,996 items of data are available, covering 83,313 participants.
Defined-instances run from 2 to 3, labelled using Instancing
2.
Units of measurement are mm2.
| Maximum | 2872 |
| Decile 9 | 1841 |
| Decile 8 | 1730 |
| Decile 7 | 1656 |
| Decile 6 | 1594 |
| Median | 1541 |
| Decile 4 | 1489 |
| Decile 3 | 1435 |
| Decile 2 | 1376 |
| Decile 1 | 1300 |
| Minimum | 887 |
|
|
- Mean = 1558.56
- Std.dev = 213.706
- 89 items above graph maximum of 2382
|
2 Instances
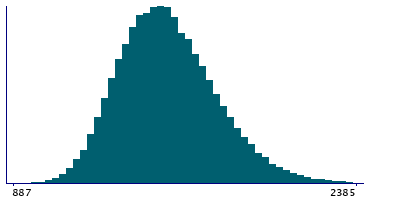
Instance 2 : Imaging visit (2014+)
83,241 participants, 83,241 items
| Maximum | 2872 |
| Decile 9 | 1841 |
| Decile 8 | 1730 |
| Decile 7 | 1655 |
| Decile 6 | 1594 |
| Median | 1541 |
| Decile 4 | 1489 |
| Decile 3 | 1435 |
| Decile 2 | 1376 |
| Decile 1 | 1300 |
| Minimum | 887 |
|

|
- Mean = 1558.33
- Std.dev = 213.881
- 87 items above graph maximum of 2382
|
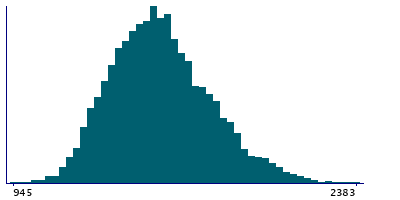
Instance 3 : First repeat imaging visit (2019+)
4,755 participants, 4,755 items
| Maximum | 2593 |
| Decile 9 | 1844 |
| Decile 8 | 1738 |
| Decile 7 | 1658 |
| Decile 6 | 1597 |
| Median | 1545 |
| Decile 4 | 1497 |
| Decile 3 | 1443 |
| Decile 2 | 1381 |
| Decile 1 | 1305 |
| Minimum | 945 |
|
|
- Mean = 1562.66
- Std.dev = 210.58
- 2 items above graph maximum of 2383
|
Notes
Area of G-precentral in the left hemisphere generated by parcellation of the white surface using Destrieux (a2009s) parcellation
0 Related Data-Fields
There are no related data-fields
0 Resources
There are no matching Resources
