Data
87,996 items of data are available, covering 83,313 participants.
Defined-instances run from 2 to 3, labelled using Instancing
2.
Units of measurement are mm2.
| Maximum | 1418 |
| Decile 9 | 675 |
| Decile 8 | 619 |
| Decile 7 | 578 |
| Decile 6 | 543 |
| Median | 509 |
| Decile 4 | 474 |
| Decile 3 | 435 |
| Decile 2 | 390 |
| Decile 1 | 331 |
| Minimum | 5 |
|
|
- Mean = 506.604
- Std.dev = 133.751
- 16 items above graph maximum of 1019
|
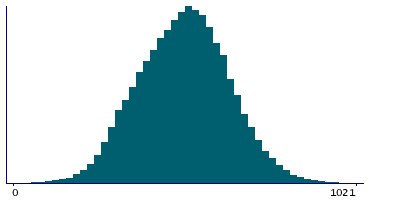
2 Instances
Instance 2 : Imaging visit (2014+)
83,241 participants, 83,241 items
| Maximum | 1418 |
| Decile 9 | 675 |
| Decile 8 | 619 |
| Decile 7 | 577.5 |
| Decile 6 | 543 |
| Median | 509 |
| Decile 4 | 474 |
| Decile 3 | 435 |
| Decile 2 | 391 |
| Decile 1 | 331 |
| Minimum | 13 |
|

|
- Mean = 506.683
- Std.dev = 133.659
- 15 items above graph maximum of 1019
|
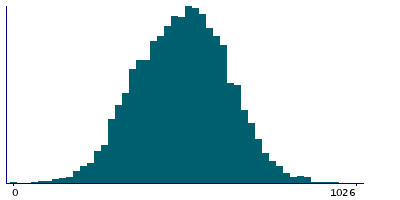
Instance 3 : First repeat imaging visit (2019+)
4,755 participants, 4,755 items
| Maximum | 1049 |
| Decile 9 | 677 |
| Decile 8 | 622 |
| Decile 7 | 580 |
| Decile 6 | 544 |
| Median | 509 |
| Decile 4 | 472 |
| Decile 3 | 432 |
| Decile 2 | 384 |
| Decile 1 | 328 |
| Minimum | 5 |
|
|
- Mean = 505.232
- Std.dev = 135.342
- 1 item above graph maximum of 1026
|
Notes
Area of G-subcallosal in the left hemisphere generated by parcellation of the white surface using Destrieux (a2009s) parcellation
0 Related Data-Fields
There are no related data-fields
0 Resources
There are no matching Resources
